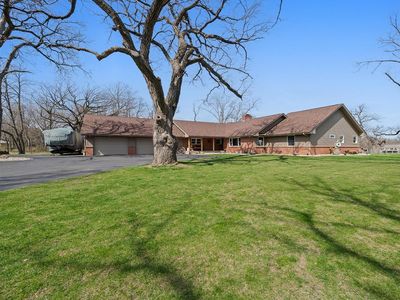
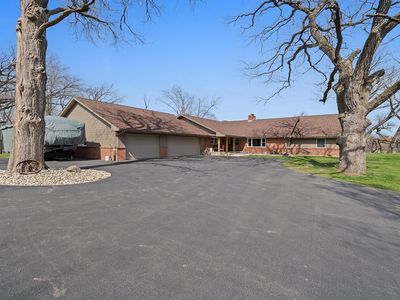
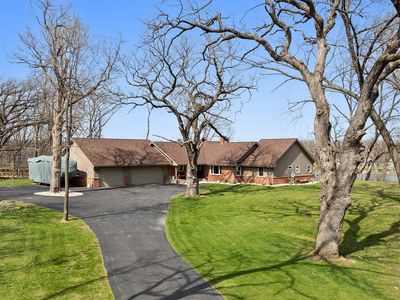
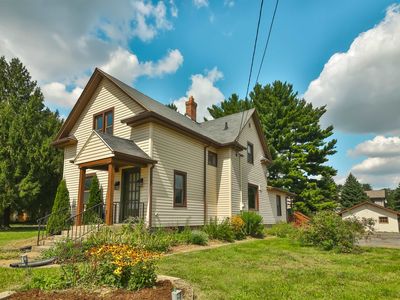
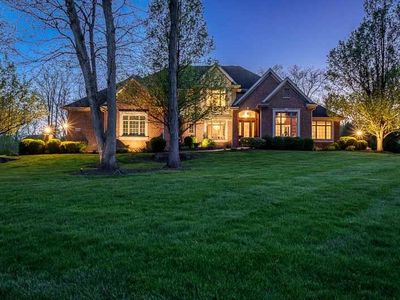
1831 Castle DrRockfordIL61103
INVESTMENT ANALYSIS
Investment Verdict
Appreciation PlayGlobal investors willing to prioritise equity over near-term yield will find 1831 Castle Dr, Rockford, IL, 61103 in Rockford worth study. Rental yield 2.62%. The 2.62% gross yield is below cash-flow benchmarks at $975,000, but 5% annual appreciation, adding $269,375 over five years, frames this as a capital growth position. Rent of $2,128/mo partially offsets the $4,384/mo payment. Ziffy Mortgage finances appreciation-play properties (0.49 DSCR) for non-U.S. residents without domestic income documentation; a 30–35% down payment maximises coverage. Total projected return: $74,657.
| This Property | City Avg | |
|---|---|---|
| Gross Rental Yield | 2.6% | 9.2% |
| Monthly Cash Flow | $(4,635) | $450 |
City averages based on Rockford market data in our database. Property projections are estimates.
DSCR Rental Loan Qualification
Qualifies using the property's rental income, not your personal income.
- ✓No W-2, pay stubs, or tax returns needed
- ✓Rental income qualifies you
- ✓Built for real estate investors
| Monthly Rental Income | $2,128 |
| Total Monthly Debt Service | $6,375 |
| DSCR Ratio | 0.33x |
Ziffy Mortgage typically prefers a DSCR of 1.0+, but in some cases you may qualify with a DSCR below 1. To explore if this deal qualifies for an investment mortgage, book time with your loan officer →
Estimates assume 6.0% rate / 30-yr fixed, 30% down, 1% tax, 0.5% insurance. Not a commitment to lend.
Single Family
Built in 1950
6.01 Acres lot
$N/A/sqft
No HOA
Neighborhood Data
Neighborhood data shown for ZIP Code: 61103, Rockford, IL area.
Housing Distribution
Housing Statistics
| Category | Value |
|---|---|
| Total HU (Housing Units) | 11,046 (100%) |
| Owner Occupied HU | 5,025 (45.5%) |
| Renter Occupied HU | 4,904 (44.4%) |
| Vacant Housing Units | 1,117 (10.1%) |
| Median Home Value | $143,110 |
| Average Home Value | $176,481 |
Housing Distribution
Address Breakdown
Residential
10,229
Single Family
8,022
Multi-Family
2,207
Businesses
400


Nearby investment properties with comparable rents
Nearby investment properties with comparable prices

Ziffy AI Summary
A quick, investor-focused snapshot highlighting income strength, yield potential.
| Key metrics | Value |
|---|---|
| Price | $399,900 |
| Est. Rent | $3,200/mo |
| ROI | 18% |
- Attractive rent-to-price ratio for income stability
- Good fit for DSCR financing with healthy coverage
Single Family
Built in 1950
6.01 Acres lot
$N/A/sqft
No HOA
Neighborhood Data
Neighborhood data shown for ZIP Code: 61103, Rockford, IL area.
Housing Distribution
Housing Statistics
| Category | Value |
|---|---|
| Total HU (Housing Units) | 11,046 (100%) |
| Owner Occupied HU | 5,025 (45.5%) |
| Renter Occupied HU | 4,904 (44.4%) |
| Vacant Housing Units | 1,117 (10.1%) |
| Median Home Value | $143,110 |
| Average Home Value | $176,481 |
Housing Distribution
Address Breakdown
Residential
10,229
Single Family
8,022
Multi-Family
2,207
Businesses
400
Nearby investment properties with comparable rents
Nearby investment properties with comparable prices
Listed by: Toni Vander Heyden • Keller Williams Realty Signature
Mls Name: NorthWest Illinois Alliance of REALTORS
Mls Provider:
Mls ID: #202501899
Disclaimer: IDX information is provided exclusively for personal, non-commercial use, and may not be used for any purpose other than to identify prospective properties consumers may be interested in purchasing. Information is deemed reliable but not guaranteed.