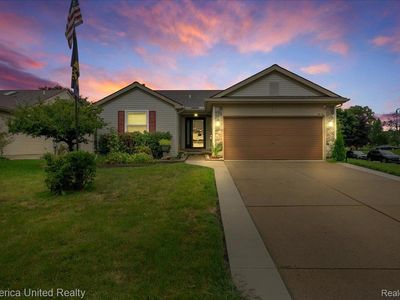
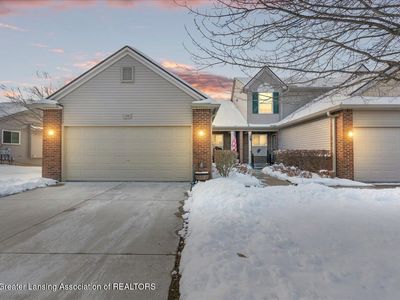
1816 Andover BlvdHowellMI48843
INVESTMENT ANALYSIS
Investment Verdict
Strong Cash FlowThe yield at 1816 Andover Blvd, Howell, MI, 48843 in Howell speaks for itself: 11.15% gross on a $370,000 price, generating $3,438/mo in rent and $998/mo in net income after the $1,664/mo debt service. DSCR 2.07, a wide margin that supports Ziffy Mortgage's DSCR loan without any personal income check. Annual cash flow of $11,976 stacks alongside $102,224 in projected five-year appreciation and $3,408/yr in principal reduction. Projected total cumulative return: $205,150.
| This Property | City Avg | |
|---|---|---|
| Gross Rental Yield | 11.2% | 6.0% |
| Monthly Cash Flow | $998 | $250 |
City averages based on Howell market data in our database. Property projections are estimates.
DSCR Loan Qualification
| Monthly Rental Income | $3,438 |
| Total Monthly Debt Service | $2,293 |
| DSCR Ratio | 1.50x |
Ziffy Mortgage: Your DSCR most likely meets our 1.0+ requirement, so you'll most probably qualify for our standard DSCR investment loan program. To pre-qualify, book time with your loan officer →
Estimates assume 6.0% rate / 30-yr fixed, 30% down, 1% tax, 0.5% insurance. Not a commitment to lend.
Single Family
Built in 1997
9,147 sqft lot
$N/A/sqft
No HOA
Neighborhood Data
Neighborhood data shown for ZIP Code: 48843, Howell, MI area.
Housing Distribution
Housing Statistics
| Category | Value |
|---|---|
| Total HU (Housing Units) | 20,156 (100%) |
| Owner Occupied HU | 15,805 (78.4%) |
| Renter Occupied HU | 3,715 (18.4%) |
| Vacant Housing Units | 636 ( 3.2%) |
| Median Home Value | $367,579 |
| Average Home Value | $397,756 |
Housing Distribution
Address Breakdown
Residential
19,681
Single Family
18,246
Multi-Family
1,435
Businesses
1,098


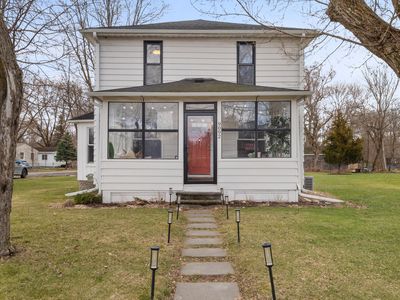
Nearby investment properties with comparable rents
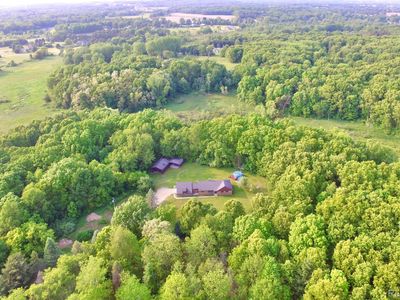
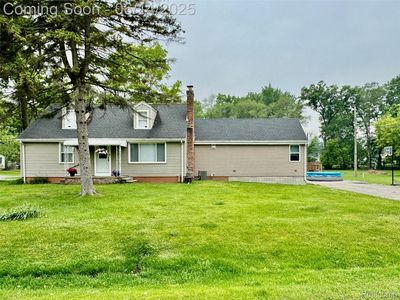
Nearby investment properties with comparable prices

Ziffy AI Summary
A quick, investor-focused snapshot highlighting income strength, yield potential.
| Key metrics | Value |
|---|---|
| Price | $399,900 |
| Est. Rent | $3,200/mo |
| ROI | 18% |
- Attractive rent-to-price ratio for income stability
- Good fit for DSCR financing with healthy coverage
Single Family
Built in 1997
9,147 sqft lot
$N/A/sqft
No HOA
Neighborhood Data
Neighborhood data shown for ZIP Code: 48843, Howell, MI area.
Housing Distribution
Housing Statistics
| Category | Value |
|---|---|
| Total HU (Housing Units) | 20,156 (100%) |
| Owner Occupied HU | 15,805 (78.4%) |
| Renter Occupied HU | 3,715 (18.4%) |
| Vacant Housing Units | 636 ( 3.2%) |
| Median Home Value | $367,579 |
| Average Home Value | $397,756 |
Housing Distribution
Address Breakdown
Residential
19,681
Single Family
18,246
Multi-Family
1,435
Businesses
1,098
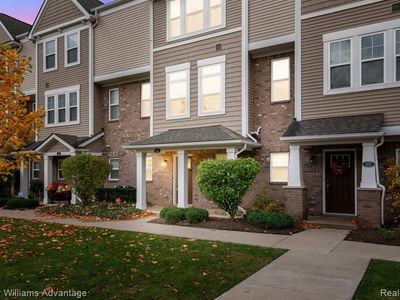
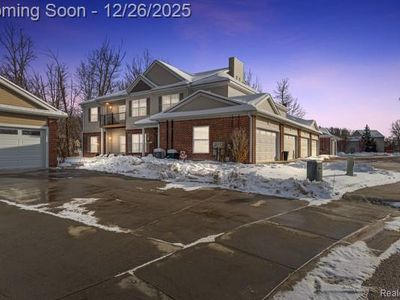
Nearby investment properties with comparable rents
Nearby investment properties with comparable prices