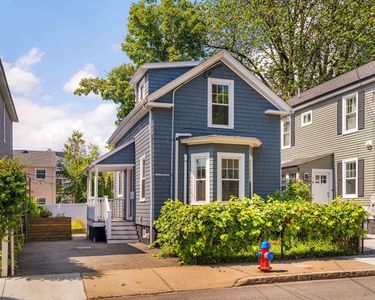
170 Jersey StMarbleheadMA01945


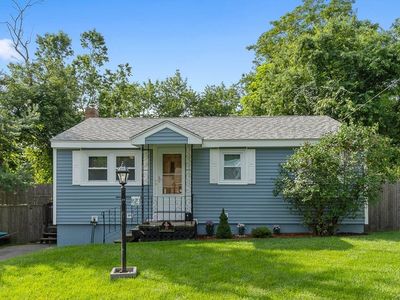
Nearby investment properties with comparable rents

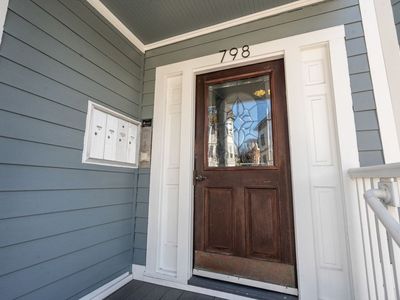
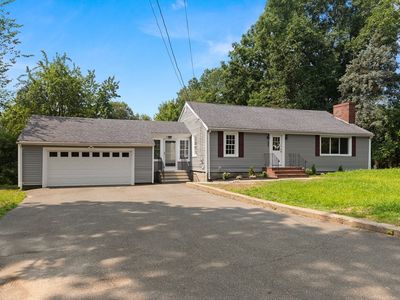
Nearby investment properties with comparable prices


Ziffy AI Summary
A quick, investor-focused snapshot highlighting income strength, yield potential.
| Key metrics | Value |
|---|---|
| Price | $399,900 |
| Est. Rent | $3,200/mo |
| ROI | 18% |
- Attractive rent-to-price ratio for income stability
- Good fit for DSCR financing with healthy coverage
Investment Highlights
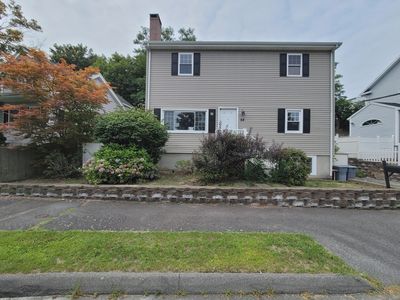
Investment property for sale in Marblehead at 170 Jersey St, Marblehead, MA, 01945 listed at $609,600 pairs $4,800/mo rent with a $2,984/mo payment to leave $957/mo cash flow. Total monthly income runs $4,800/mo, and annual cash flow reaches $11,490/yr on $200,558 cash to close. Return on cash invested measures 25.79% in year one, and rental yield registers 9.45% at a $609,600 basis. Equity gained on principal adds $3,934/yr, and annual property appreciation at 5% supports $168,421 by year five. Five-year ROI tracks 134.5% and total cumulative return in cash totals $269,750. Financing can be arranged with Ziffy Mortgage’s DSCR loan, which qualifies using $4,800/mo property income relative to a $2,984/mo payment rather than your personal income (W2, Tax Returns, Paystubs, or 1099).
Single Family
Built in 1930
4,791 sqft lot
$N/A/sqft
No HOA
Neighborhood Data
Neighborhood data shown for ZIP Code: 01945, Marblehead, MA area.
Housing Distribution
Housing Statistics
| Category | Value |
|---|---|
| Total HU (Housing Units) | 8,975 (100%) |
| Owner Occupied HU | 6,644 (74.0%) |
| Renter Occupied HU | 1,712 (19.1%) |
| Vacant Housing Units | 619 ( 6.9%) |
| Median Home Value | $959,132 |
| Average Home Value | $1,107,514 |
Housing Distribution
Address Breakdown
Residential
8,778
Single Family
8,126
Multi-Family
652
Businesses
936
Nearby investment properties with comparable rents
Nearby investment properties with comparable prices
Listed by: N/A • N/A
Mls Name: undefined
Mls ID: #N/A