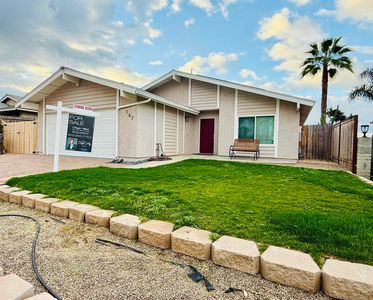
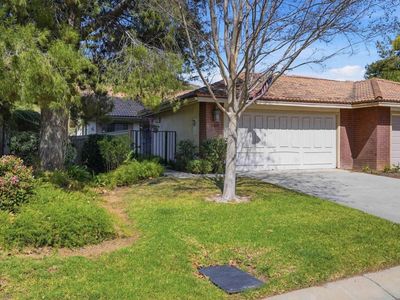
167 Harrison StOceansideCA92057
INVESTMENT ANALYSIS
Investment Verdict
Steady Equity Builder167 Harrison St, Oceanside, CA, 92057 in Oceanside earns a respectable 7.72% gross yield at $800,000, but after the $3,597/mo mortgage the net cash flow is $198/mo, a tight but positive spread. Expense discipline (vacancy, management, maintenance) will determine whether the margin widens. Ziffy Mortgage's DSCR mortgage (1.43) still qualifies on property income; a larger down payment can improve the cash-flow buffer. Long-term, 5% appreciation projects $221,025 over five years, making equity the dominant return driver. Total projected return: $316,111.
| This Property | City Avg | |
|---|---|---|
| Gross Rental Yield | 7.7% | 5.1% |
| Monthly Cash Flow | $198 | $1,200 |
City averages based on Oceanside market data in our database. Property projections are estimates.
DSCR Loan Qualification
| Monthly Rental Income | $5,147 |
| Total Monthly Debt Service | $4,631 |
| DSCR Ratio | 1.11x |
Ziffy Mortgage: Your DSCR most likely meets our 1.0+ requirement, so you'll most probably qualify for our standard DSCR investment loan program. To pre-qualify, book time with your loan officer →
Estimates assume 6.0% rate / 30-yr fixed, 30% down, 1% tax, 0.5% insurance. Not a commitment to lend.
Single Family
Built in 1976
5,703 sqft lot
$N/A/sqft
No HOA
Neighborhood Data
Neighborhood data shown for ZIP Code: 92057, Oceanside, CA area.
Housing Distribution
Housing Statistics
| Category | Value |
|---|---|
| Total HU (Housing Units) | 20,327 (100%) |
| Owner Occupied HU | 13,437 (66.1%) |
| Renter Occupied HU | 6,049 (29.8%) |
| Vacant Housing Units | 841 ( 4.1%) |
| Median Home Value | $787,909 |
| Average Home Value | $801,460 |
Housing Distribution
Address Breakdown
Residential
19,670
Single Family
18,356
Multi-Family
1,314
Businesses
237


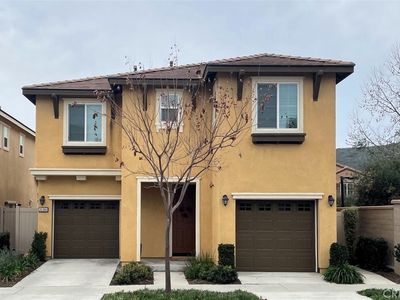
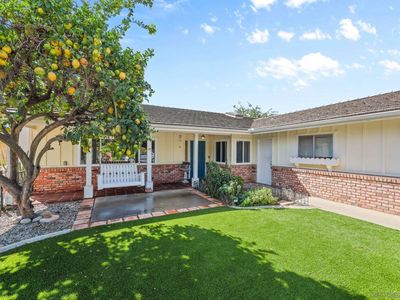
Nearby investment properties with comparable rents

Nearby investment properties with comparable prices
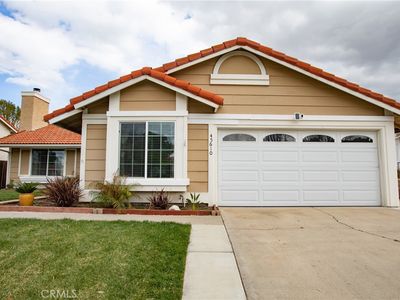

Ziffy AI Summary
A quick, investor-focused snapshot highlighting income strength, yield potential.
| Key metrics | Value |
|---|---|
| Price | $399,900 |
| Est. Rent | $3,200/mo |
| ROI | 18% |
- Attractive rent-to-price ratio for income stability
- Good fit for DSCR financing with healthy coverage
Single Family
Built in 1976
5,703 sqft lot
$N/A/sqft
No HOA
Neighborhood Data
Neighborhood data shown for ZIP Code: 92057, Oceanside, CA area.
Housing Distribution
Housing Statistics
| Category | Value |
|---|---|
| Total HU (Housing Units) | 20,327 (100%) |
| Owner Occupied HU | 13,437 (66.1%) |
| Renter Occupied HU | 6,049 (29.8%) |
| Vacant Housing Units | 841 ( 4.1%) |
| Median Home Value | $787,909 |
| Average Home Value | $801,460 |
Housing Distribution
Address Breakdown
Residential
19,670
Single Family
18,356
Multi-Family
1,314
Businesses
237
Nearby investment properties with comparable rents
Nearby investment properties with comparable prices
Listed by: Diego A Velez • Real Broker
Mls Name: SDMLS
Mls Provider:
Mls ID: #250018641
Disclaimer: This information is deemed reliable but not guaranteed. You should rely on this information only to decide whether or not to further investigate a particular property. BEFORE MAKING ANY OTHER DECISION, YOU SHOULD PERSONALLY INVESTIGATE THE FACTS (e.g. square footage and lot size) with the assistance of an appropriate professional. You may use this information only to identify properties you may be interested in investigating further. All uses except for personal, noncommercial use in accordance with the foregoing purpose are prohibited. Redistribution or copying of this information, any photographs or video tours is strictly prohibited. This information is derived from the Internet Data Exchange (IDX) service provided by San Diego MLS. Displayed property listings may be held by a brokerage firm other than the broker and/or agent responsible for this display. The information and any photographs and video tours and the compilation from which they are derived is protected by copyright. Compilation 2025 San Diego MLS.