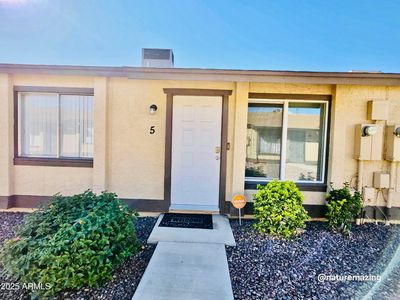
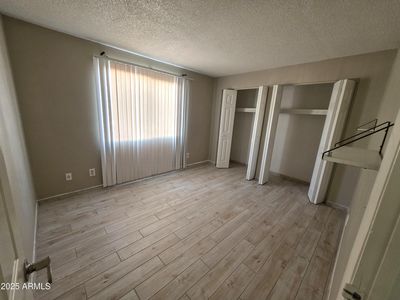
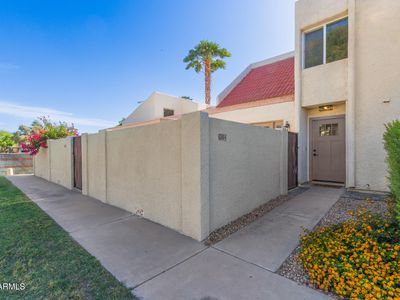
1616 N 63rd Ave APT 5PhoenixAZ85035


Nearby investment properties with comparable rents
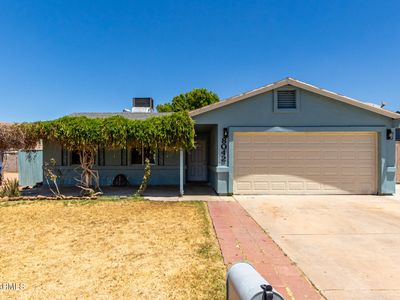
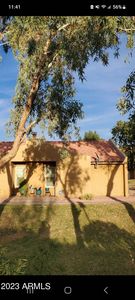
Nearby investment properties with comparable prices

Ziffy AI Summary
A quick, investor-focused snapshot highlighting income strength, yield potential.
| Key metrics | Value |
|---|---|
| Price | $399,900 |
| Est. Rent | $3,200/mo |
| ROI | 18% |
- Attractive rent-to-price ratio for income stability
- Good fit for DSCR financing with healthy coverage
Investment Highlights
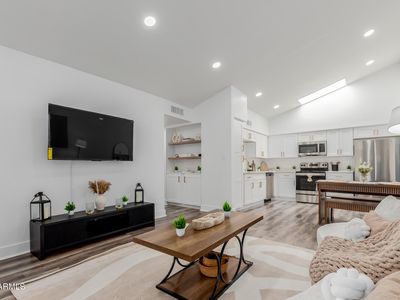
Investment property for sale in Phoenix at 1616 N 63rd Ave APT 5, Phoenix, AZ, 85035 listed at $210,000 pairs $2,034/mo rent with a $1,028/mo payment to leave $793/mo cash flow. Total monthly income runs $2,034/mo, and annual cash flow reaches $9,510/yr on $69,615 cash to close. Return on cash invested measures 33.57% in year one, and rental yield registers 11.62% at a $210,000 basis. Equity gained on principal adds $1,355/yr, and annual property appreciation at 5% supports $58,019 by year five. Five-year ROI tracks 175.76% and total cumulative return in cash totals $122,356. Financing can be arranged with Ziffy Mortgage’s DSCR loan, which qualifies using $2,034/mo property income relative to a $1,028/mo payment rather than your personal income (W2, Tax Returns, Paystubs, or 1099).
Townhouse
Built in 1982
1,821 sqft lot
$N/A/sqft
No HOA
Neighborhood Data
Neighborhood data shown for ZIP Code: 85035, Phoenix, AZ area.
Housing Distribution
Housing Statistics
| Category | Value |
|---|---|
| Total HU (Housing Units) | 13,789 (100%) |
| Owner Occupied HU | 6,863 (49.8%) |
| Renter Occupied HU | 6,252 (45.3%) |
| Vacant Housing Units | 674 ( 4.9%) |
| Median Home Value | $265,008 |
| Average Home Value | $341,796 |
Housing Distribution
Address Breakdown
Residential
15,055
Single Family
8,195
Multi-Family
6,860
Businesses
310
Nearby investment properties with comparable rents
Nearby investment properties with comparable prices