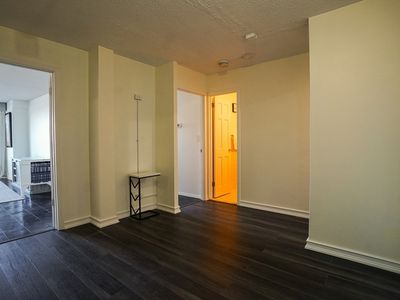
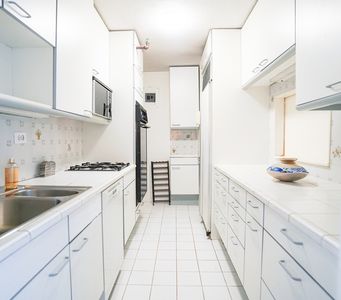
151 Tremont St APT 10PBostonMA02111

INVESTMENT ANALYSIS
Investment Verdict
Appreciation PlayGlobal investors willing to prioritise equity over near-term yield will find 151 Tremont St APT 10P, Boston, MA, 02111 in Boston worth study. Rental yield 4.87%. The 4.87% gross yield is below cash-flow benchmarks at $1,395,000, but 5% annual appreciation, adding $385,413 over five years, frames this as a capital growth position. Rent of $5,657/mo partially offsets the $6,273/mo payment. Ziffy Mortgage finances appreciation-play properties (0.90 DSCR) for non-U.S. residents without domestic income documentation; a 30–35% down payment maximises coverage. Total projected return: $257,694.
| This Property | City Avg | |
|---|---|---|
| Gross Rental Yield | 4.9% | 4.2% |
| Monthly Cash Flow | $(4,306) | $1,850 |
City averages based on Boston market data in our database. Property projections are estimates.
DSCR Loan Qualification
| Monthly Rental Income | $5,657 |
| Total Monthly Debt Service | $9,407 |
| DSCR Ratio | 0.60x |
Ziffy Mortgage typically prefers a DSCR of 1.0+, but in some cases you may qualify with a DSCR below 1. To explore if this deal qualifies for an investment mortgage, book time with your loan officer →
Estimates assume 6.0% rate / 30-yr fixed, 30% down, 1% tax, 0.5% insurance. Not a commitment to lend.
Condo
Built in 1968
1,160 sqft lot
$N/A/sqft
$1,170 monthly HOA
Neighborhood Data
Neighborhood data shown for ZIP Code: 02111, Boston, MA area.
Housing Distribution
Housing Statistics
| Category | Value |
|---|---|
| Total HU (Housing Units) | 4,709 (100%) |
| Owner Occupied HU | 1,035 (22.0%) |
| Renter Occupied HU | 2,958 (62.8%) |
| Vacant Housing Units | 716 (15.2%) |
| Median Home Value | $1,128,543 |
| Average Home Value | $1,267,136 |
Housing Distribution
Address Breakdown
Residential
4,889
Single Family
282
Multi-Family
4,607
Businesses
1,048


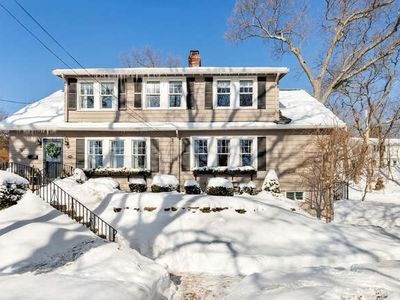
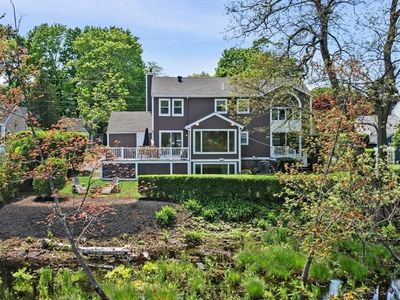
Nearby investment properties with comparable rents

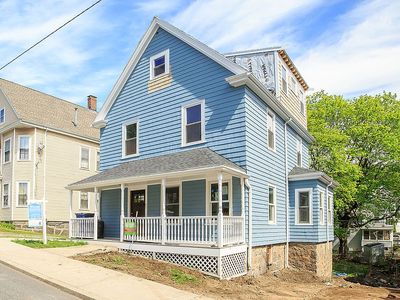
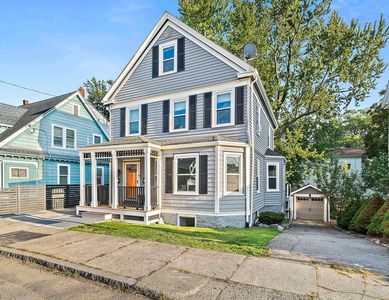
Nearby investment properties with comparable prices


Ziffy AI Summary
A quick, investor-focused snapshot highlighting income strength, yield potential.
| Key metrics | Value |
|---|---|
| Price | $399,900 |
| Est. Rent | $3,200/mo |
| ROI | 18% |
- Attractive rent-to-price ratio for income stability
- Good fit for DSCR financing with healthy coverage
Condo
Built in 1968
1,160 sqft lot
$N/A/sqft
$1,170 monthly HOA
Neighborhood Data
Neighborhood data shown for ZIP Code: 02111, Boston, MA area.
Housing Distribution
Housing Statistics
| Category | Value |
|---|---|
| Total HU (Housing Units) | 4,709 (100%) |
| Owner Occupied HU | 1,035 (22.0%) |
| Renter Occupied HU | 2,958 (62.8%) |
| Vacant Housing Units | 716 (15.2%) |
| Median Home Value | $1,128,543 |
| Average Home Value | $1,267,136 |
Housing Distribution
Address Breakdown
Residential
4,889
Single Family
282
Multi-Family
4,607
Businesses
1,048
Nearby investment properties with comparable rents
Nearby investment properties with comparable prices