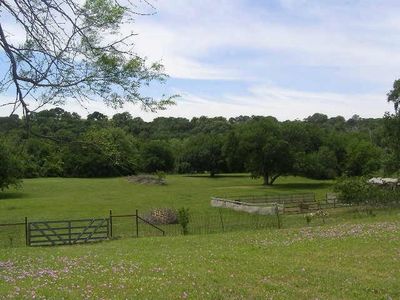
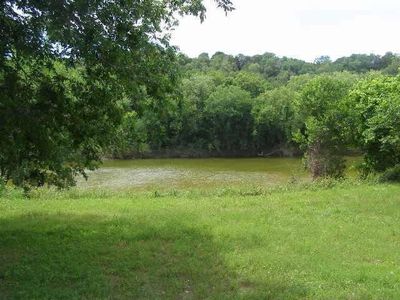
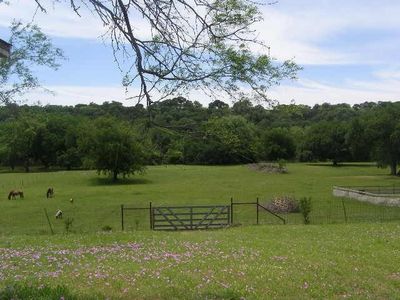
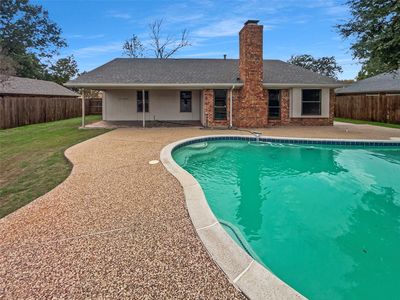
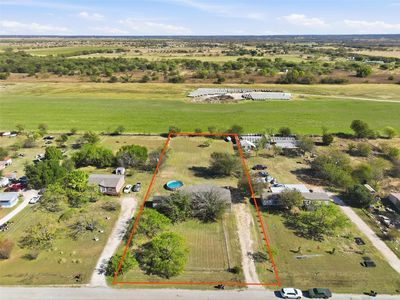
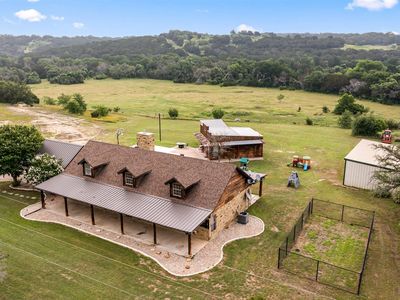
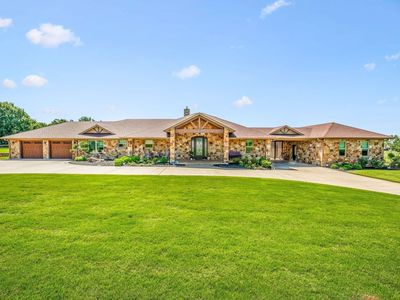
15023 Mitchell Bend CtGranburyTX76048


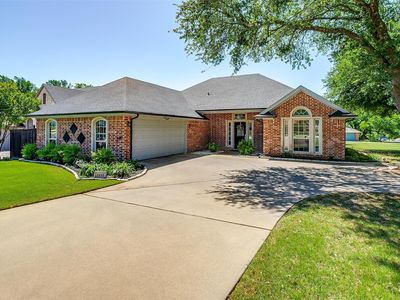
Nearby investment properties with comparable rents
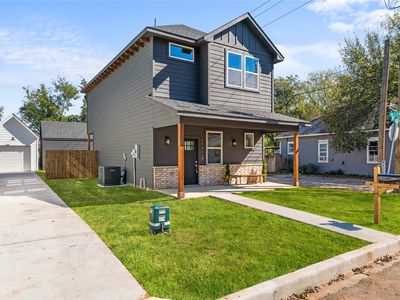
Nearby investment properties with comparable prices

Ziffy AI Summary
A quick, investor-focused snapshot highlighting income strength, yield potential.
| Key metrics | Value |
|---|---|
| Price | $399,900 |
| Est. Rent | $3,200/mo |
| ROI | 18% |
- Attractive rent-to-price ratio for income stability
- Good fit for DSCR financing with healthy coverage
Investment Highlights
Rental property for sale in Granbury at 15023 Mitchell Bend Ct, Granbury, TX, 76048 priced at $1,308,800 pairs $2,666/mo rent with after a $6,406/mo payment. Total monthly income equals $2,666/mo. Return on cash invested is 1.58% in year one, and rental yield stands at 2.44% on a $1,308,800 basis. Equity gained on principal adds $8,445/yr, and 5% annual appreciation accumulates to $361,597 by year five. Five-year ROI measures 5.67% and total cumulative return in cash reaches $24,042. For financing, Ziffy Mortgage’s DSCR program evaluates $2,666/mo property income against a $6,406/mo payment instead of your W2s, 1099s, or Tax returns.
Single Family
Built in 1996
5.20 Acres lot
$N/A/sqft
No HOA
Neighborhood Data
Neighborhood data shown for ZIP Code: 76048, Granbury, TX area.
Housing Distribution
Housing Statistics
| Category | Value |
|---|---|
| Total HU (Housing Units) | 14,104 (100%) |
| Owner Occupied HU | 8,556 (60.7%) |
| Renter Occupied HU | 3,550 (25.2%) |
| Vacant Housing Units | 1,998 (14.2%) |
| Median Home Value | $325,457 |
| Average Home Value | $424,077 |
Housing Distribution
Address Breakdown
Residential
13,237
Single Family
11,571
Multi-Family
1,666
Businesses
1,306
Nearby investment properties with comparable rents
Nearby investment properties with comparable prices