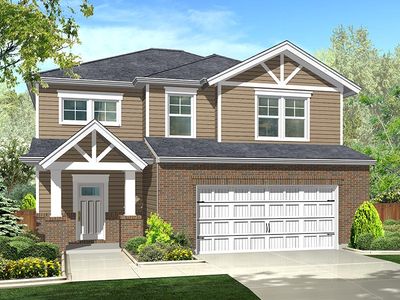
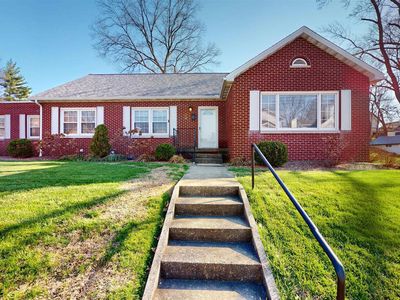
1402 N Hunters Crossing PassHuntingburgIN47542
INVESTMENT ANALYSIS
Investment Verdict
Solid IncomeThe income profile at 1402 N Hunters Crossing Pass, Huntingburg, IN, 47542 in Huntingburg is straightforward: $350,300 in, $2,873/mo in rent, $392/mo out after debt service. The 9.84% gross yield and 1.82 DSCR make this exactly the kind of asset Ziffy Mortgage finances for non-U.S. residents without income documentation. Appreciation at 5%/yr adds $96,781 by year five. With $3,226/yr in principal equity, the total cumulative return is projected at $159,513.
| This Property | City Avg | |
|---|---|---|
| Gross Rental Yield | 9.8% | 8.0% |
| Monthly Cash Flow | $392 | $400 |
City averages based on Huntingburg market data in our database. Property projections are estimates.
DSCR Loan Qualification
| Monthly Rental Income | $2,873 |
| Total Monthly Debt Service | $2,341 |
| DSCR Ratio | 1.23x |
Ziffy Mortgage: Your DSCR most likely meets our 1.0+ requirement, so you'll most probably qualify for our standard DSCR investment loan program. To pre-qualify, book time with your loan officer →
Estimates assume 6.0% rate / 30-yr fixed, 30% down, 1% tax, 0.5% insurance. Not a commitment to lend.
Single Family
Built in 2023
0.30 Acres lot
$N/A/sqft
$4 monthly HOA
Neighborhood Data
Neighborhood data shown for ZIP Code: 47542, Huntingburg, IN area.
Housing Distribution
Housing Statistics
| Category | Value |
|---|---|
| Total HU (Housing Units) | 4,220 (100%) |
| Owner Occupied HU | 2,943 (69.7%) |
| Renter Occupied HU | 1,039 (24.6%) |
| Vacant Housing Units | 238 ( 5.6%) |
| Median Home Value | $219,462 |
| Average Home Value | $269,048 |
Housing Distribution
Address Breakdown
Residential
4,197
Single Family
4,112
Multi-Family
85
Businesses
318


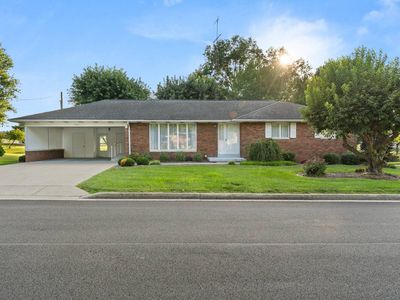
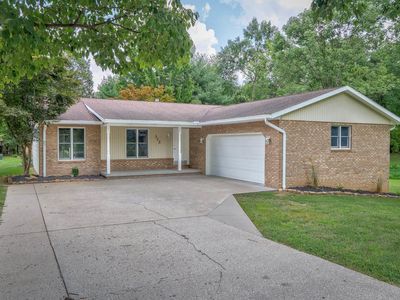
Nearby investment properties with comparable rents
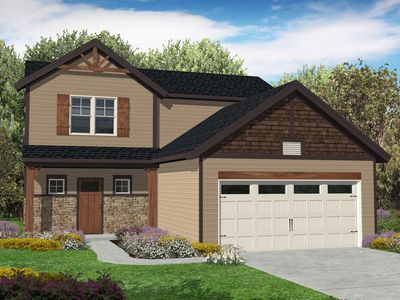
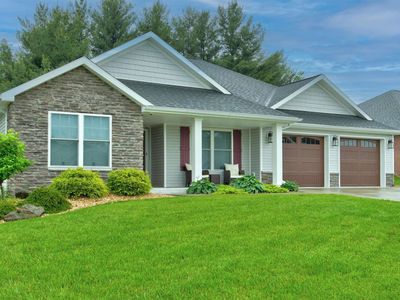
Nearby investment properties with comparable prices

Ziffy AI Summary
A quick, investor-focused snapshot highlighting income strength, yield potential.
| Key metrics | Value |
|---|---|
| Price | $399,900 |
| Est. Rent | $3,200/mo |
| ROI | 18% |
- Attractive rent-to-price ratio for income stability
- Good fit for DSCR financing with healthy coverage
Single Family
Built in 2023
0.30 Acres lot
$N/A/sqft
$4 monthly HOA
Neighborhood Data
Neighborhood data shown for ZIP Code: 47542, Huntingburg, IN area.
Housing Distribution
Housing Statistics
| Category | Value |
|---|---|
| Total HU (Housing Units) | 4,220 (100%) |
| Owner Occupied HU | 2,943 (69.7%) |
| Renter Occupied HU | 1,039 (24.6%) |
| Vacant Housing Units | 238 ( 5.6%) |
| Median Home Value | $219,462 |
| Average Home Value | $269,048 |
Housing Distribution
Address Breakdown
Residential
4,197
Single Family
4,112
Multi-Family
85
Businesses
318
Nearby investment properties with comparable rents
Nearby investment properties with comparable prices
Listed by: N/A • N/A
Mls Name: undefined
Mls ID: #N/A