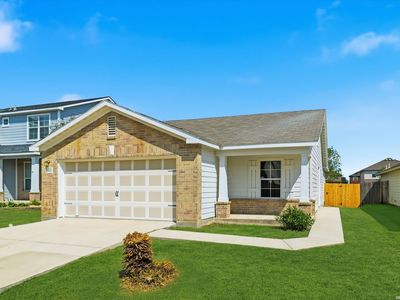
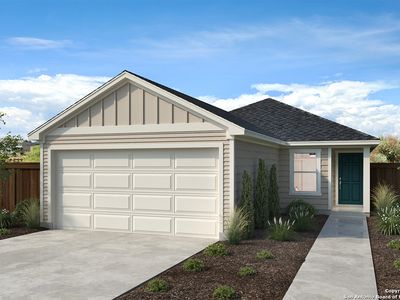
13818 Pebble WalkSan AntonioTX78217

INVESTMENT ANALYSIS
Investment Verdict
Strong Cash FlowThis San Antonio rental at 13818 Pebble Walk, San Antonio, TX, 78217 sits in the solid-income band: 10.19% gross yield, $2,377/mo rent, $386/mo net after the $1,228/mo debt service, DSCR 1.94. Entry price of $273,200 is well-calibrated for the income it produces. Ziffy Mortgage finances this type of asset on rental income alone, no tax returns, no U.S. credit profile. Projected five-year appreciation of $75,480 and $2,516/yr in principal reduction bring total cumulative return to $107,184.
| This Property | City Avg | |
|---|---|---|
| Gross Rental Yield | 10.2% | 5.8% |
| Monthly Cash Flow | $386 | $450 |
City averages based on San Antonio market data in our database. Property projections are estimates.
DSCR Loan Qualification
| Monthly Rental Income | $2,377 |
| Total Monthly Debt Service | $2,259 |
| DSCR Ratio | 1.05x |
Ziffy Mortgage: Your DSCR most likely meets our 1.0+ requirement, so you'll most probably qualify for our standard DSCR investment loan program. To pre-qualify, book time with your loan officer →
Estimates assume 6.0% rate / 30-yr fixed, 30% down, 1% tax, 0.5% insurance. Not a commitment to lend.
Single Family
Built in 1978
9,073 sqft lot
$N/A/sqft
$425 monthly HOA
Neighborhood Data
Neighborhood data shown for ZIP Code: 78217, San Antonio, TX area.
Housing Distribution
Housing Statistics
| Category | Value |
|---|---|
| Total HU (Housing Units) | 14,809 (100%) |
| Owner Occupied HU | 6,314 (42.6%) |
| Renter Occupied HU | 7,413 (50.1%) |
| Vacant Housing Units | 1,082 ( 7.3%) |
| Median Home Value | $249,208 |
| Average Home Value | $264,619 |
Housing Distribution
Address Breakdown
Residential
15,927
Single Family
8,022
Multi-Family
7,905
Businesses
2,879


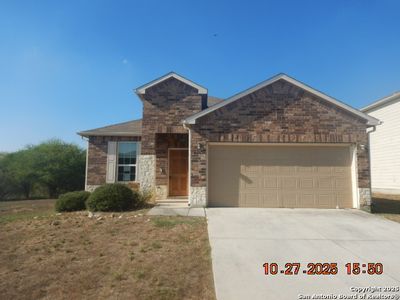
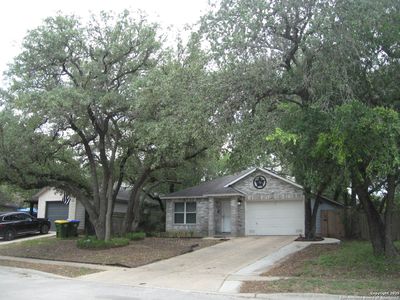
Nearby investment properties with comparable rents
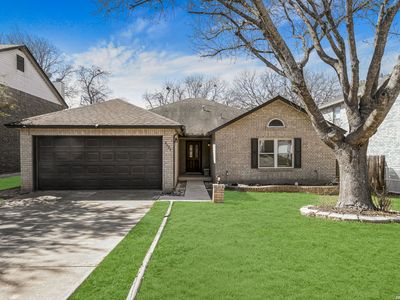
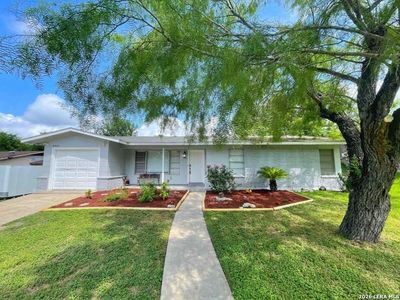
Nearby investment properties with comparable prices
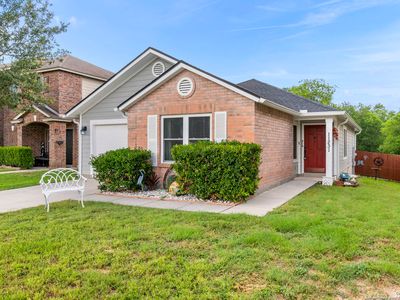

Ziffy AI Summary
A quick, investor-focused snapshot highlighting income strength, yield potential.
| Key metrics | Value |
|---|---|
| Price | $399,900 |
| Est. Rent | $3,200/mo |
| ROI | 18% |
- Attractive rent-to-price ratio for income stability
- Good fit for DSCR financing with healthy coverage
Single Family
Built in 1978
9,073 sqft lot
$N/A/sqft
$425 monthly HOA
Neighborhood Data
Neighborhood data shown for ZIP Code: 78217, San Antonio, TX area.
Housing Distribution
Housing Statistics
| Category | Value |
|---|---|
| Total HU (Housing Units) | 14,809 (100%) |
| Owner Occupied HU | 6,314 (42.6%) |
| Renter Occupied HU | 7,413 (50.1%) |
| Vacant Housing Units | 1,082 ( 7.3%) |
| Median Home Value | $249,208 |
| Average Home Value | $264,619 |
Housing Distribution
Address Breakdown
Residential
15,927
Single Family
8,022
Multi-Family
7,905
Businesses
2,879
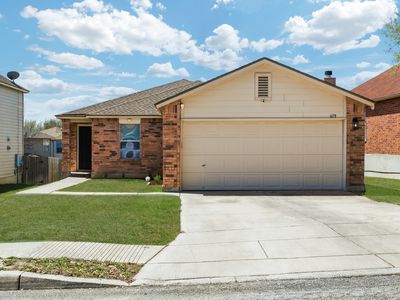
Nearby investment properties with comparable rents
Nearby investment properties with comparable prices
Listed by: N/A • N/A
Mls Name: undefined
Mls ID: #N/A