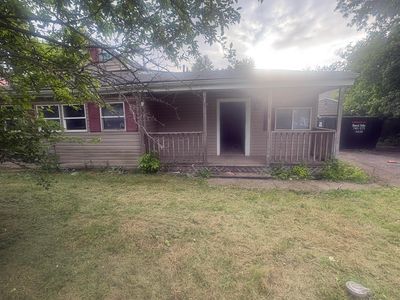
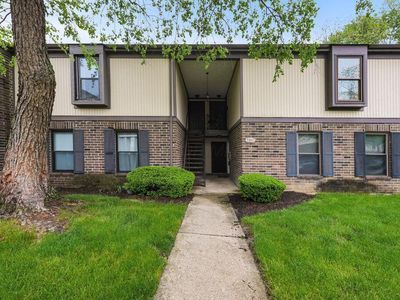
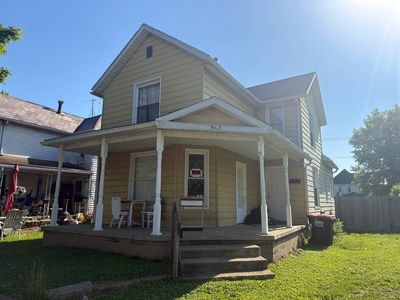
13775 Queen Rd NEThornvilleOH43076
INVESTMENT ANALYSIS
Investment Verdict
Solid IncomeThe 9.27% yield at 13775 Queen Rd NE, Thornville, OH, 43076 in Thornville is solid, but the $539/mo payment compresses net cash flow to $137/mo at $119,900. This is a tight-spread property, income covers debt, with little cushion. For investors who can optimise occupancy, the upside is real: 5% annual appreciation adds $33,126 by year five, and $1,104/yr in loan paydown builds equity. Ziffy Mortgage qualifies this via DSCR (1.72) without U.S. income documentation. Total projected return: $54,564.
| This Property | National Avg | |
|---|---|---|
| Gross Rental Yield | 9.3% | 6.2% |
| Monthly Cash Flow | $137 | $180 |
National averages based on 2024–2025 U.S. residential rental market data. Content is user-generated and unverified.
DSCR Rental Loan Qualification
Qualifies using the property's rental income, not your personal income.
- ✓No W-2, pay stubs, or tax returns needed
- ✓Rental income qualifies you
- ✓Built for real estate investors
| Monthly Rental Income | $926 |
| Total Monthly Debt Service | $741 |
| DSCR Ratio | 1.25x |
Ziffy Mortgage: Your DSCR most likely meets our 1.0+ requirement, so you'll most probably qualify for our standard DSCR investment loan program. To pre-qualify, book time with your loan officer →
Estimates assume 6.0% rate / 30-yr fixed, 30% down, 1% tax, 0.5% insurance. Not a commitment to lend.
Single Family
Built in 1900
7,840 sqft lot
$N/A/sqft
No HOA
Neighborhood Data
Neighborhood data shown for ZIP Code: 43076, Thornville, OH area.
Housing Distribution
Housing Statistics
| Category | Value |
|---|---|
| Total HU (Housing Units) | 4,305 (100%) |
| Owner Occupied HU | 3,244 (75.4%) |
| Renter Occupied HU | 560 (13.0%) |
| Vacant Housing Units | 501 (11.6%) |
| Median Home Value | $348,080 |
| Average Home Value | $380,263 |
Housing Distribution
Address Breakdown
Residential
3,873
Single Family
3,873
Multi-Family
0
Businesses
153


Nearby investment properties with comparable rents
Nearby investment properties with comparable prices

Ziffy AI Summary
A quick, investor-focused snapshot highlighting income strength, yield potential.
| Key metrics | Value |
|---|---|
| Price | $399,900 |
| Est. Rent | $3,200/mo |
| ROI | 18% |
- Attractive rent-to-price ratio for income stability
- Good fit for DSCR financing with healthy coverage
Single Family
Built in 1900
7,840 sqft lot
$N/A/sqft
No HOA
Neighborhood Data
Neighborhood data shown for ZIP Code: 43076, Thornville, OH area.
Housing Distribution
Housing Statistics
| Category | Value |
|---|---|
| Total HU (Housing Units) | 4,305 (100%) |
| Owner Occupied HU | 3,244 (75.4%) |
| Renter Occupied HU | 560 (13.0%) |
| Vacant Housing Units | 501 (11.6%) |
| Median Home Value | $348,080 |
| Average Home Value | $380,263 |
Housing Distribution
Address Breakdown
Residential
3,873
Single Family
3,873
Multi-Family
0
Businesses
153
Nearby investment properties with comparable rents
Nearby investment properties with comparable prices
Listed by: N/A • N/A
Mls Name: Columbus and Central Ohio Regional MLS
Mls ID: #226018352