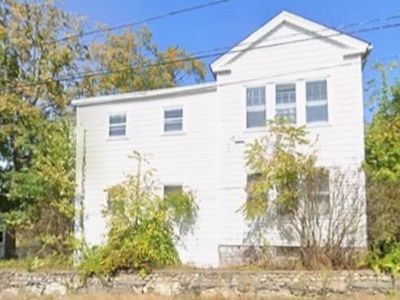
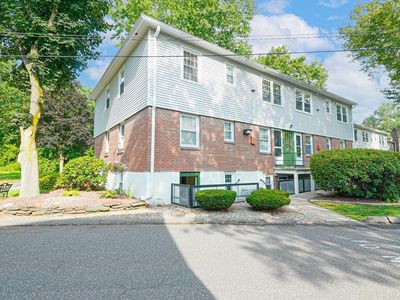
133 Granby RdSouth HadleyMA01075


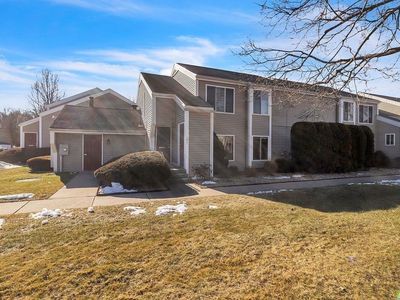
Nearby investment properties with comparable rents
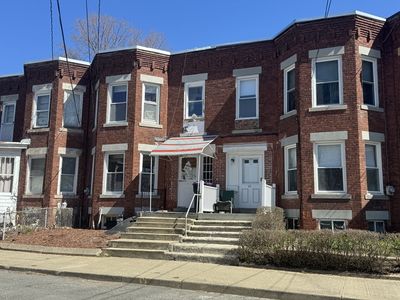
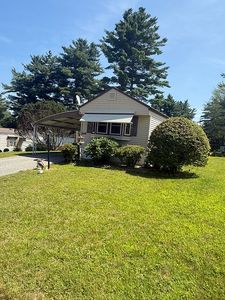
Nearby investment properties with comparable prices


Ziffy AI Summary
A quick, investor-focused snapshot highlighting income strength, yield potential.
| Key metrics | Value |
|---|---|
| Price | $399,900 |
| Est. Rent | $3,200/mo |
| ROI | 18% |
- Attractive rent-to-price ratio for income stability
- Good fit for DSCR financing with healthy coverage
Investment Highlights
Investment property for sale in South Hadley at 133 Granby Rd, South Hadley, MA, 01075 offers a 12.96% rental yield on a $194,400 purchase with $2,100/mo rent. Total monthly income registers $2,100/mo, and a $951/mo payment leaves $875/mo available for distribution. Annual cash flow reaches $10,503/yr on $64,444 to close, and return on cash invested stands at 36.21% in year one. Equity gained on principal adds $1,254/yr while 5% annual appreciation supports $53,709 over five years. Portfolio math shows five-year ROI at 190.46% and total cumulative return in cash at $122,738. Financing is available via Ziffy Mortgage’s DSCR loan, which evaluates $2,100/mo property income against a $951/mo payment rather than investor’s personal income documents like W2s, Salary slips, and Tax returns.
Single Family
Built in 1830
0.30 Acres lot
$N/A/sqft
No HOA
Neighborhood Data
Neighborhood data shown for ZIP Code: 01075, South Hadley, MA area.
Housing Distribution
Housing Statistics
| Category | Value |
|---|---|
| Total HU (Housing Units) | 7,562 (100%) |
| Owner Occupied HU | 5,395 (71.3%) |
| Renter Occupied HU | 1,814 (24.0%) |
| Vacant Housing Units | 353 ( 4.7%) |
| Median Home Value | $394,079 |
| Average Home Value | $438,698 |
Housing Distribution
Address Breakdown
Residential
7,165
Single Family
6,544
Multi-Family
621
Businesses
448
Nearby investment properties with comparable rents
Nearby investment properties with comparable prices
Listed by: N/A • N/A
Mls Name: undefined
Mls ID: #N/A