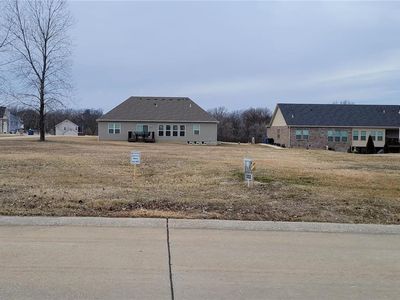
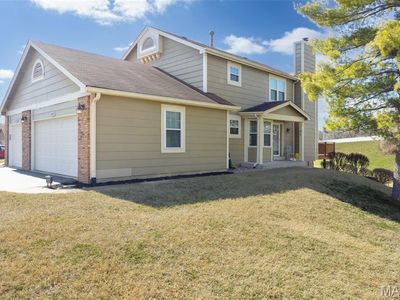
13107 Ambrose CtBlack JackMO63033
INVESTMENT ANALYSIS
Investment Verdict
Steady Equity BuilderThe cash-flow margin at 13107 Ambrose Ct, Black Jack, MO, 63033 in Black Jack is narrow, $42/mo net on $2,066/mo rent after the $1,461/mo debt service, but the property operates at break-even-plus, not a loss. At $325,000 with a 7.63% yield, the long-run equity case via 5% appreciation ($89,792 over five years) and $2,993/yr in principal paydown is where the returns accumulate. Ziffy Mortgage's 1.41 DSCR loan requires no W-2s or U.S. credit. Total projected cumulative return: $126,030.
| This Property | National Avg | |
|---|---|---|
| Gross Rental Yield | 7.6% | 6.2% |
| Monthly Cash Flow | $42 | $180 |
National averages based on 2024–2025 U.S. residential rental market data. Content is user-generated and unverified.
DSCR Rental Loan Qualification
Qualifies using the property's rental income, not your personal income.
- ✓No W-2, pay stubs, or tax returns needed
- ✓Rental income qualifies you
- ✓Built for real estate investors
| Monthly Rental Income | $2,066 |
| Total Monthly Debt Service | $1,895 |
| DSCR Ratio | 1.09x |
Ziffy Mortgage: Your DSCR most likely meets our 1.0+ requirement, so you'll most probably qualify for our standard DSCR investment loan program. To pre-qualify, book time with your loan officer →
Estimates assume 6.0% rate / 30-yr fixed, 30% down, 1% tax, 0.5% insurance. Not a commitment to lend.
Single Family
Built in N/A
9,583 sqft lot
$N/A/sqft
No HOA
Neighborhood Data
Neighborhood data shown for ZIP Code: 63033, Florissant, MO area.
Housing Distribution
Housing Statistics
| Category | Value |
|---|---|
| Total HU (Housing Units) | 18,341 (100%) |
| Owner Occupied HU | 10,869 (59.3%) |
| Renter Occupied HU | 5,935 (32.4%) |
| Vacant Housing Units | 1,537 ( 8.4%) |
| Median Home Value | $164,599 |
| Average Home Value | $182,286 |
Housing Distribution
Address Breakdown
Residential
17,409
Single Family
14,466
Multi-Family
2,943
Businesses
639


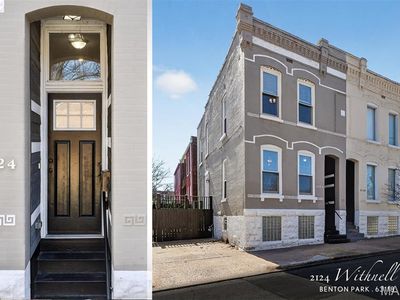
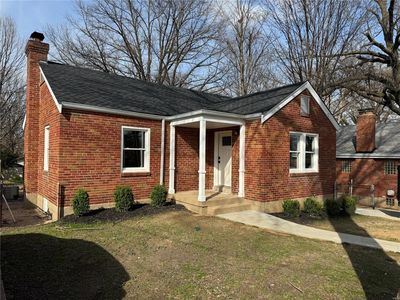
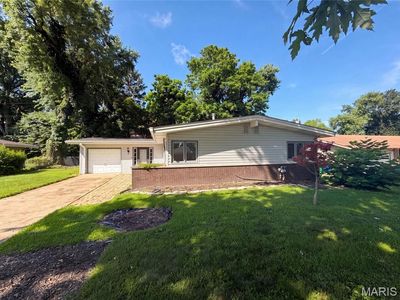
Nearby investment properties with comparable rents
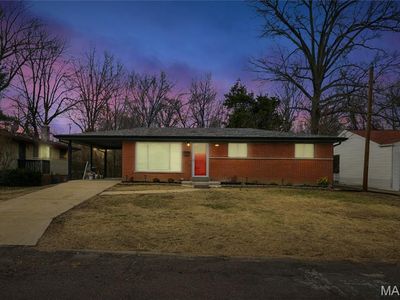
Nearby investment properties with comparable prices
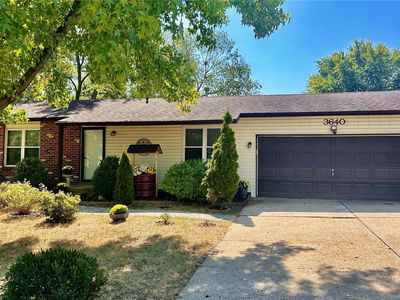

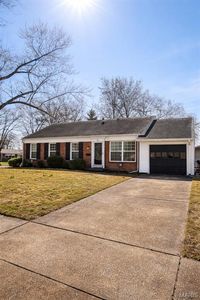
Ziffy AI Summary
A quick, investor-focused snapshot highlighting income strength, yield potential.
| Key metrics | Value |
|---|---|
| Price | $399,900 |
| Est. Rent | $3,200/mo |
| ROI | 18% |
- Attractive rent-to-price ratio for income stability
- Good fit for DSCR financing with healthy coverage
Single Family
Built in N/A
9,583 sqft lot
$N/A/sqft
No HOA
Neighborhood Data
Neighborhood data shown for ZIP Code: 63033, Florissant, MO area.
Housing Distribution
Housing Statistics
| Category | Value |
|---|---|
| Total HU (Housing Units) | 18,341 (100%) |
| Owner Occupied HU | 10,869 (59.3%) |
| Renter Occupied HU | 5,935 (32.4%) |
| Vacant Housing Units | 1,537 ( 8.4%) |
| Median Home Value | $164,599 |
| Average Home Value | $182,286 |
Housing Distribution
Address Breakdown
Residential
17,409
Single Family
14,466
Multi-Family
2,943
Businesses
639
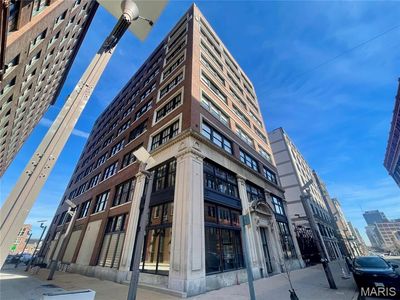
Nearby investment properties with comparable rents
Nearby investment properties with comparable prices
Listed by: Wendy G Widder-Tyson • Wood Brothers Realty
Mls Name: MARIS
Mls ID: #24009531