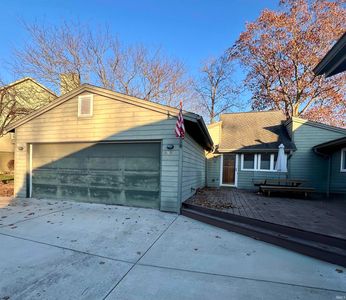
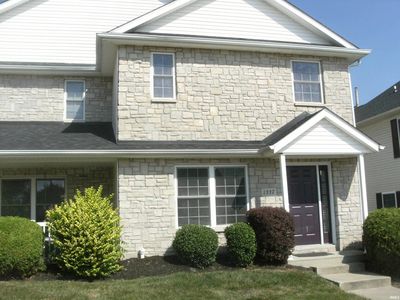
1308 E Short StBloomingtonIN47401
INVESTMENT ANALYSIS
Investment Verdict
Strong Cash Flow1308 E Short St, Bloomington, IN, 47401 in Bloomington earns its strong cash-flow label: 10.5% yield, $2,285/mo rent, $718/mo net income, DSCR 1.95. The $261,000 acquisition cost produces immediate returns that put this property in the top tier for U.S. income assets accessible via Ziffy Mortgage's rental-income underwriting. Long-term, 5% annual appreciation adds $72,109 by year five. Combined with $2,404/yr in principal paydown, total projected return reaches $144,962.
| This Property | City Avg | |
|---|---|---|
| Gross Rental Yield | 10.5% | 6.1% |
| Monthly Cash Flow | $718 | $420 |
City averages based on Bloomington market data in our database. Property projections are estimates.
DSCR Loan Qualification
| Monthly Rental Income | $2,285 |
| Total Monthly Debt Service | $1,463 |
| DSCR Ratio | 1.56x |
Ziffy Mortgage: Your DSCR most likely meets our 1.0+ requirement, so you'll most probably qualify for our standard DSCR investment loan program. To pre-qualify, book time with your loan officer →
Estimates assume 6.0% rate / 30-yr fixed, 30% down, 1% tax, 0.5% insurance. Not a commitment to lend.
Single Family
Built in 2023
1,306 sqft lot
$N/A/sqft
No HOA
Neighborhood Data
Neighborhood data shown for ZIP Code: 47401, Bloomington, IN area.
Housing Distribution
Housing Statistics
| Category | Value |
|---|---|
| Total HU (Housing Units) | 20,651 (100%) |
| Owner Occupied HU | 10,173 (49.3%) |
| Renter Occupied HU | 8,522 (41.3%) |
| Vacant Housing Units | 1,956 ( 9.5%) |
| Median Home Value | $366,019 |
| Average Home Value | $425,030 |
Housing Distribution
Address Breakdown
Residential
20,256
Single Family
16,493
Multi-Family
3,763
Businesses
911


Nearby investment properties with comparable rents

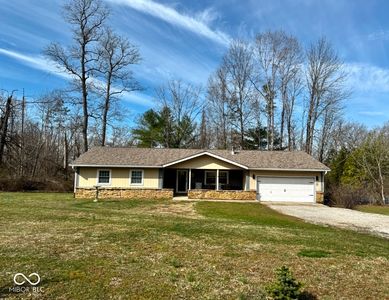
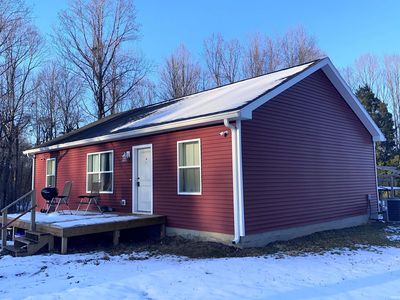
Nearby investment properties with comparable prices

Ziffy AI Summary
A quick, investor-focused snapshot highlighting income strength, yield potential.
| Key metrics | Value |
|---|---|
| Price | $399,900 |
| Est. Rent | $3,200/mo |
| ROI | 18% |
- Attractive rent-to-price ratio for income stability
- Good fit for DSCR financing with healthy coverage
Single Family
Built in 2023
1,306 sqft lot
$N/A/sqft
No HOA
Neighborhood Data
Neighborhood data shown for ZIP Code: 47401, Bloomington, IN area.
Housing Distribution
Housing Statistics
| Category | Value |
|---|---|
| Total HU (Housing Units) | 20,651 (100%) |
| Owner Occupied HU | 10,173 (49.3%) |
| Renter Occupied HU | 8,522 (41.3%) |
| Vacant Housing Units | 1,956 ( 9.5%) |
| Median Home Value | $366,019 |
| Average Home Value | $425,030 |
Housing Distribution
Address Breakdown
Residential
20,256
Single Family
16,493
Multi-Family
3,763
Businesses
911
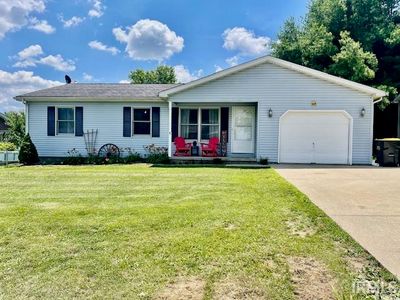
Nearby investment properties with comparable rents
Nearby investment properties with comparable prices
Listed by: N/A • N/A
Mls Name: undefined
Mls ID: #N/A