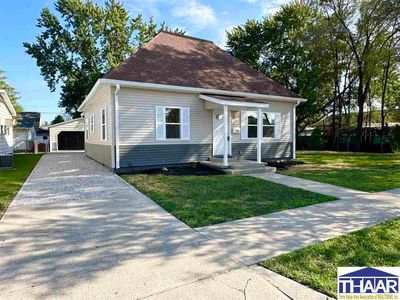
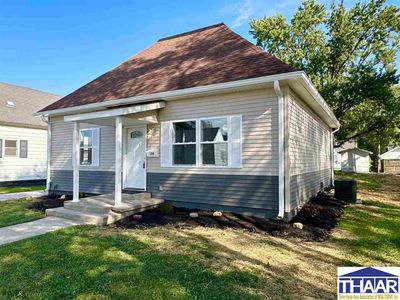
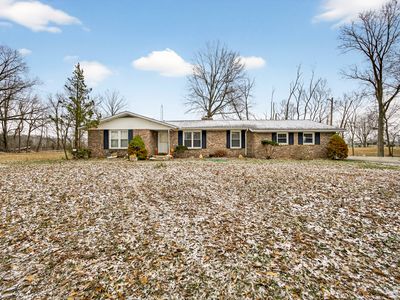
130 F St NELintonIN47441

INVESTMENT ANALYSIS
Investment Verdict
Strong Cash FlowInvestors targeting immediate dollar income will find 130 F St NE, Linton, IN, 47441 in Linton hard to pass up. The 11.58% gross yield on a $175,000 purchase results in $1,688/mo in rent and $638/mo in net cash, well above the spread required for Ziffy Mortgage's DSCR qualification (2.14). Annual cash flow of $7,655, five-year appreciation of $48,349, and $1,612/yr in equity build-up combine for a projected total cumulative return of $107,289.
| This Property | City Avg | |
|---|---|---|
| Gross Rental Yield | 11.6% | 6.0% |
| Monthly Cash Flow | $638 | $300 |
City averages based on Linton market data in our database. Property projections are estimates.
DSCR Loan Qualification
| Monthly Rental Income | $1,688 |
| Total Monthly Debt Service | $981 |
| DSCR Ratio | 1.72x |
Ziffy Mortgage: Your DSCR most likely meets our 1.0+ requirement, so you'll most probably qualify for our standard DSCR investment loan program. To pre-qualify, book time with your loan officer →
Estimates assume 6.0% rate / 30-yr fixed, 30% down, 1% tax, 0.5% insurance. Not a commitment to lend.
Single Family
Built in 1918
N/A lot
$N/A/sqft
No HOA
Neighborhood Data
Neighborhood data shown for ZIP Code: 47441, Linton, IN area.
Housing Distribution
Housing Statistics
| Category | Value |
|---|---|
| Total HU (Housing Units) | 4,152 (100%) |
| Owner Occupied HU | 2,723 (65.6%) |
| Renter Occupied HU | 1,042 (25.1%) |
| Vacant Housing Units | 387 ( 9.3%) |
| Median Home Value | $129,342 |
| Average Home Value | $176,239 |
Housing Distribution
Address Breakdown
Residential
3,937
Single Family
3,739
Multi-Family
198
Businesses
324


Nearby investment properties with comparable rents

Nearby investment properties with comparable prices


Ziffy AI Summary
A quick, investor-focused snapshot highlighting income strength, yield potential.
| Key metrics | Value |
|---|---|
| Price | $399,900 |
| Est. Rent | $3,200/mo |
| ROI | 18% |
- Attractive rent-to-price ratio for income stability
- Good fit for DSCR financing with healthy coverage
Single Family
Built in 1918
N/A lot
$N/A/sqft
No HOA
Neighborhood Data
Neighborhood data shown for ZIP Code: 47441, Linton, IN area.
Housing Distribution
Housing Statistics
| Category | Value |
|---|---|
| Total HU (Housing Units) | 4,152 (100%) |
| Owner Occupied HU | 2,723 (65.6%) |
| Renter Occupied HU | 1,042 (25.1%) |
| Vacant Housing Units | 387 ( 9.3%) |
| Median Home Value | $129,342 |
| Average Home Value | $176,239 |
Housing Distribution
Address Breakdown
Residential
3,937
Single Family
3,739
Multi-Family
198
Businesses
324
Nearby investment properties with comparable rents
Nearby investment properties with comparable prices