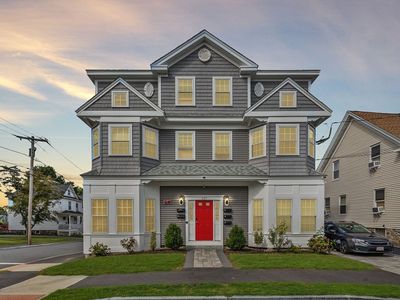
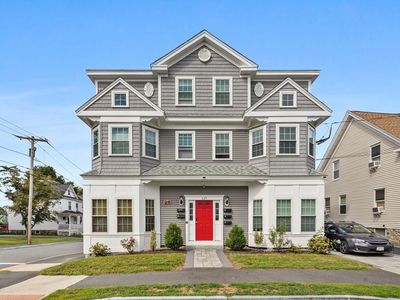
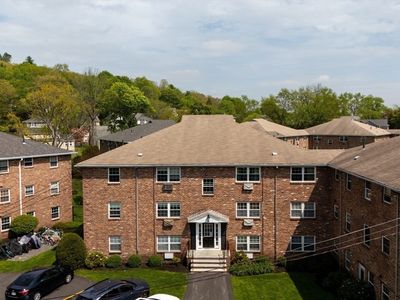
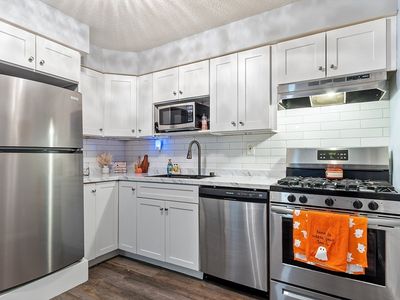
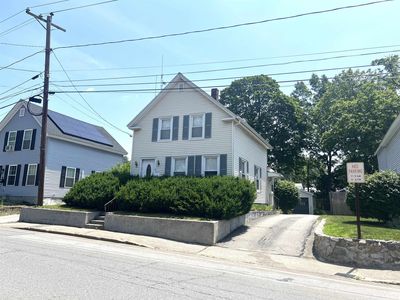
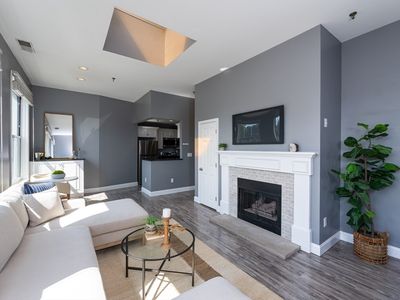
127 Marblehead St #ANorth AndoverMA01845
INVESTMENT ANALYSIS
Investment Verdict
Steady Equity BuilderThis is a cash-flow-light asset: 127 Marblehead St #A, North Andover, MA, 01845 in North Andover, $365,000, 7.97% gross yield, $123/mo net income. Consider it a market-entry position, the $2,424/mo rent covers the $1,641/mo payment with a margin, and 5%/yr appreciation is projected to add $100,843 to the asset's value over five years. Ziffy Mortgage approves DSCR loans (coverage 1.48) for non-U.S. residents without domestic income documentation. Consider a higher down payment to widen the monthly margin. Total projected return: $146,556.
| This Property | City Avg | |
|---|---|---|
| Gross Rental Yield | 8% | 5.5% |
| Monthly Cash Flow | $123 | $350 |
City averages based on North Andover market data in our database. Property projections are estimates.
DSCR Rental Loan Qualification
Qualifies using the property's rental income, not your personal income.
- ✓No W-2, pay stubs, or tax returns needed
- ✓Rental income qualifies you
- ✓Built for real estate investors
| Monthly Rental Income | $2,424 |
| Total Monthly Debt Service | $2,155 |
| DSCR Ratio | 1.12x |
Ziffy Mortgage: Your DSCR most likely meets our 1.0+ requirement, so you'll most probably qualify for our standard DSCR investment loan program. To pre-qualify, book time with your loan officer →
Estimates assume 6.0% rate / 30-yr fixed, 30% down, 1% tax, 0.5% insurance. Not a commitment to lend.
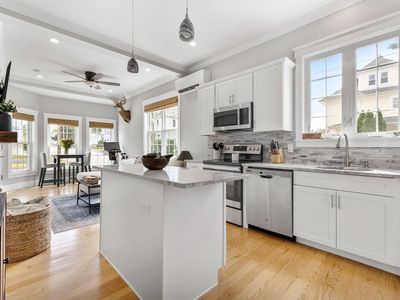
Condo
Built in 2022
N/A lot
$N/A/sqft
No HOA
Neighborhood Data
Neighborhood data shown for ZIP Code: 01845, North Andover, MA area.
Housing Distribution
Housing Statistics
| Category | Value |
|---|---|
| Total HU (Housing Units) | 12,358 (100%) |
| Owner Occupied HU | 8,307 (67.2%) |
| Renter Occupied HU | 3,501 (28.3%) |
| Vacant Housing Units | 550 ( 4.5%) |
| Median Home Value | $773,736 |
| Average Home Value | $807,808 |
Housing Distribution
Address Breakdown
Residential
12,197
Single Family
8,665
Multi-Family
3,532
Businesses
1,177


Nearby investment properties with comparable rents
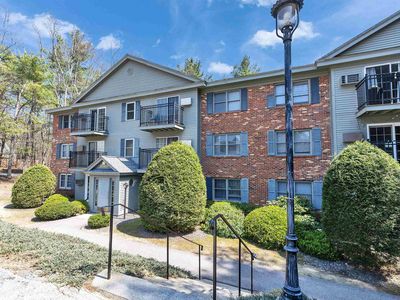
Nearby investment properties with comparable prices
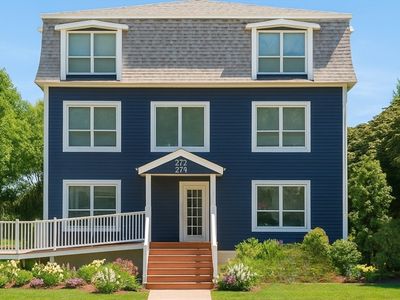

Ziffy AI Summary
A quick, investor-focused snapshot highlighting income strength, yield potential.
| Key metrics | Value |
|---|---|
| Price | $399,900 |
| Est. Rent | $3,200/mo |
| ROI | 18% |
- Attractive rent-to-price ratio for income stability
- Good fit for DSCR financing with healthy coverage
Condo
Built in 2022
N/A lot
$N/A/sqft
No HOA
Neighborhood Data
Neighborhood data shown for ZIP Code: 01845, North Andover, MA area.
Housing Distribution
Housing Statistics
| Category | Value |
|---|---|
| Total HU (Housing Units) | 12,358 (100%) |
| Owner Occupied HU | 8,307 (67.2%) |
| Renter Occupied HU | 3,501 (28.3%) |
| Vacant Housing Units | 550 ( 4.5%) |
| Median Home Value | $773,736 |
| Average Home Value | $807,808 |
Housing Distribution
Address Breakdown
Residential
12,197
Single Family
8,665
Multi-Family
3,532
Businesses
1,177
Nearby investment properties with comparable rents
Nearby investment properties with comparable prices
Listed by: The Movement Group • Compass
Mls Name: MLS PIN
Mls ID: #73440400