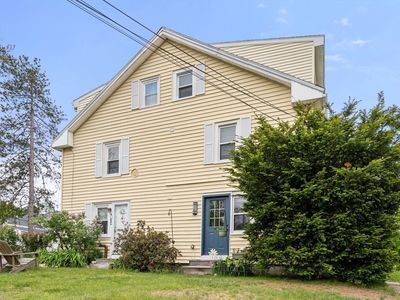
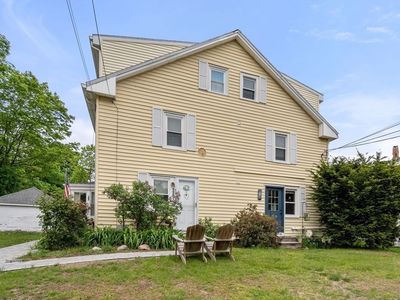
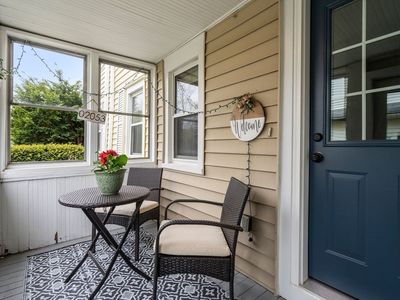
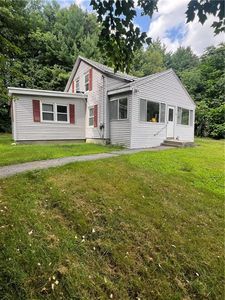
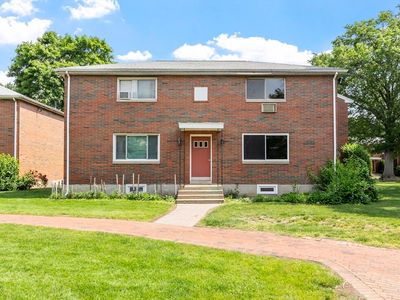
118 Village St #AMedwayMA02053
INVESTMENT ANALYSIS
Investment Verdict
Solid IncomeThe 8.12% yield at 118 Village St #A, Medway, MA, 02053 in Medway is solid, but the $1,641/mo payment compresses net cash flow to $4/mo at $365,000. This is a tight-spread property, income covers debt, with little cushion. For investors who can optimise occupancy, the upside is real: 5% annual appreciation adds $100,843 by year five, and $3,362/yr in loan paydown builds equity. Ziffy Mortgage qualifies this via DSCR (1.51) without U.S. income documentation. Total projected return: $149,496.
| This Property | City Avg | |
|---|---|---|
| Gross Rental Yield | 8.1% | 6.8% |
| Monthly Cash Flow | $4 | $450 |
City averages based on Medway market data in our database. Property projections are estimates.
DSCR Rental Loan Qualification
Qualifies using the property's rental income, not your personal income.
- ✓No W-2, pay stubs, or tax returns needed
- ✓Rental income qualifies you
- ✓Built for real estate investors
| Monthly Rental Income | $2,470 |
| Total Monthly Debt Service | $2,155 |
| DSCR Ratio | 1.15x |
Ziffy Mortgage: Your DSCR most likely meets our 1.0+ requirement, so you'll most probably qualify for our standard DSCR investment loan program. To pre-qualify, book time with your loan officer →
Estimates assume 6.0% rate / 30-yr fixed, 30% down, 1% tax, 0.5% insurance. Not a commitment to lend.
Townhouse
Built in 1830
N/A lot
$N/A/sqft
No HOA
Neighborhood Data
Neighborhood data shown for ZIP Code: 02053, Medway, MA area.
Housing Distribution
Housing Statistics
| Category | Value |
|---|---|
| Total HU (Housing Units) | 5,081 (100%) |
| Owner Occupied HU | 4,082 (80.3%) |
| Renter Occupied HU | 884 (17.4%) |
| Vacant Housing Units | 115 ( 2.3%) |
| Median Home Value | $660,112 |
| Average Home Value | $728,274 |
Housing Distribution
Address Breakdown
Residential
4,901
Single Family
4,579
Multi-Family
322
Businesses
389


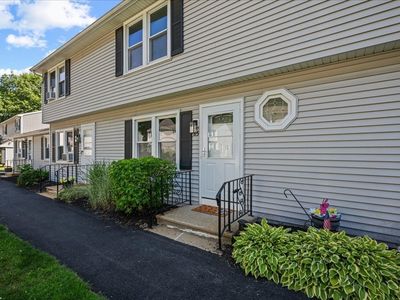
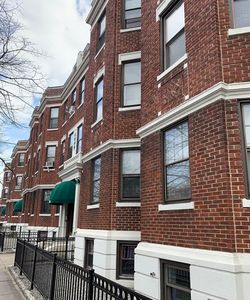
Nearby investment properties with comparable rents
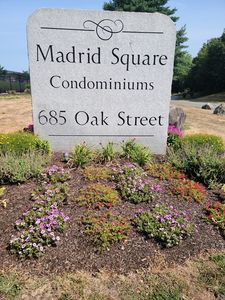
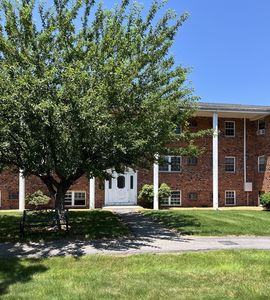
Nearby investment properties with comparable prices


Ziffy AI Summary
A quick, investor-focused snapshot highlighting income strength, yield potential.
| Key metrics | Value |
|---|---|
| Price | $399,900 |
| Est. Rent | $3,200/mo |
| ROI | 18% |
- Attractive rent-to-price ratio for income stability
- Good fit for DSCR financing with healthy coverage
Townhouse
Built in 1830
N/A lot
$N/A/sqft
No HOA
Neighborhood Data
Neighborhood data shown for ZIP Code: 02053, Medway, MA area.
Housing Distribution
Housing Statistics
| Category | Value |
|---|---|
| Total HU (Housing Units) | 5,081 (100%) |
| Owner Occupied HU | 4,082 (80.3%) |
| Renter Occupied HU | 884 (17.4%) |
| Vacant Housing Units | 115 ( 2.3%) |
| Median Home Value | $660,112 |
| Average Home Value | $728,274 |
Housing Distribution
Address Breakdown
Residential
4,901
Single Family
4,579
Multi-Family
322
Businesses
389
Nearby investment properties with comparable rents
Nearby investment properties with comparable prices
Listed by: N/A • N/A
Mls Name: MLS PIN
Mls ID: #73517478