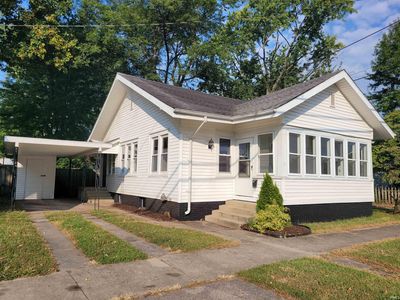
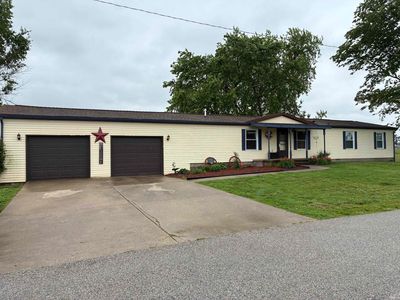
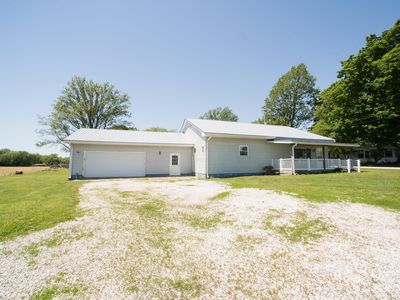
11729 E John StBicknellIN47512
INVESTMENT ANALYSIS
Investment Verdict
Steady Equity BuilderTight but positive: 11729 E John St, Bicknell, IN, 47512 in Bicknell at $176,200 earns $1,141/mo in rent and nets $84/mo after the $792/mo payment, a 7.77% yield with limited short-term income headroom. The equity story offsets the thin monthly spread: 5% annual appreciation adds $48,681 over five years. Ziffy Mortgage underwrites this on a 1.44 DSCR without U.S. credit history. With $1,623/yr in principal paydown, total projected return reaches $72,055.
| This Property | City Avg | |
|---|---|---|
| Gross Rental Yield | 7.8% | 6.0% |
| Monthly Cash Flow | $84 | $500 |
City averages based on Bicknell market data in our database. Property projections are estimates.
DSCR Rental Loan Qualification
Qualifies using the property's rental income, not your personal income.
- ✓No W-2, pay stubs, or tax returns needed
- ✓Rental income qualifies you
- ✓Built for real estate investors
| Monthly Rental Income | $1,141 |
| Total Monthly Debt Service | $988 |
| DSCR Ratio | 1.16x |
Ziffy Mortgage: Your DSCR most likely meets our 1.0+ requirement, so you'll most probably qualify for our standard DSCR investment loan program. To pre-qualify, book time with your loan officer →
Estimates assume 6.0% rate / 30-yr fixed, 30% down, 1% tax, 0.5% insurance. Not a commitment to lend.
Manufactured
Built in 2023
0.33 Acres lot
$N/A/sqft
No HOA
Neighborhood Data
Neighborhood data shown for ZIP Code: 47512, Bicknell, IN area.
Housing Distribution
Housing Statistics
| Category | Value |
|---|---|
| Total HU (Housing Units) | 2,031 (100%) |
| Owner Occupied HU | 1,175 (57.9%) |
| Renter Occupied HU | 504 (24.8%) |
| Vacant Housing Units | 352 (17.3%) |
| Median Home Value | $96,475 |
| Average Home Value | $144,134 |
Housing Distribution
Address Breakdown
Residential
1,577
Single Family
1,562
Multi-Family
15
Businesses
89


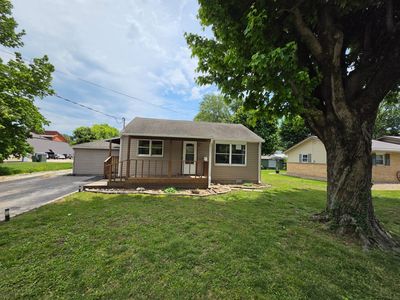
Nearby investment properties with comparable rents
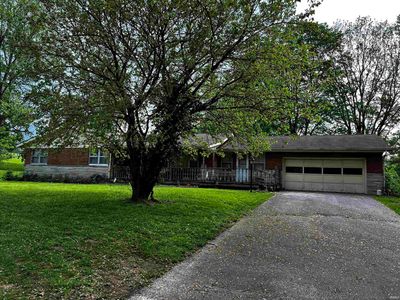
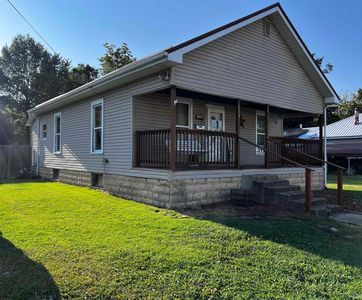
Nearby investment properties with comparable prices

Ziffy AI Summary
A quick, investor-focused snapshot highlighting income strength, yield potential.
| Key metrics | Value |
|---|---|
| Price | $399,900 |
| Est. Rent | $3,200/mo |
| ROI | 18% |
- Attractive rent-to-price ratio for income stability
- Good fit for DSCR financing with healthy coverage
Manufactured
Built in 2023
0.33 Acres lot
$N/A/sqft
No HOA
Neighborhood Data
Neighborhood data shown for ZIP Code: 47512, Bicknell, IN area.
Housing Distribution
Housing Statistics
| Category | Value |
|---|---|
| Total HU (Housing Units) | 2,031 (100%) |
| Owner Occupied HU | 1,175 (57.9%) |
| Renter Occupied HU | 504 (24.8%) |
| Vacant Housing Units | 352 (17.3%) |
| Median Home Value | $96,475 |
| Average Home Value | $144,134 |
Housing Distribution
Address Breakdown
Residential
1,577
Single Family
1,562
Multi-Family
15
Businesses
89
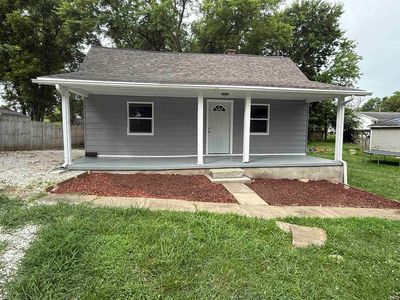
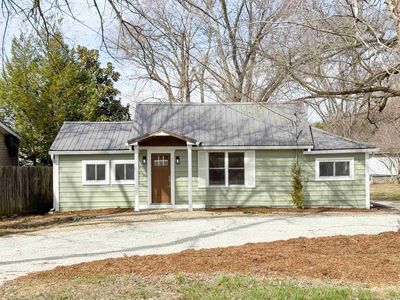
Nearby investment properties with comparable rents
Nearby investment properties with comparable prices