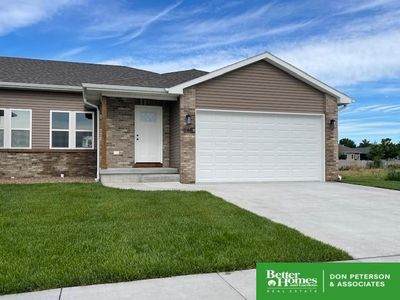
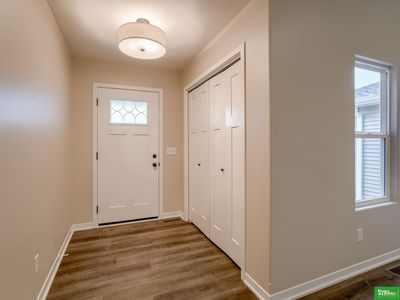
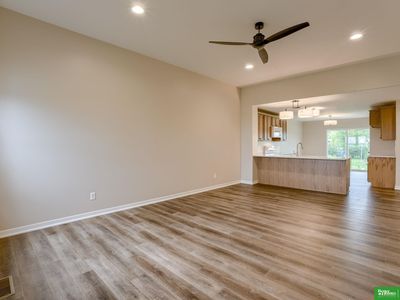
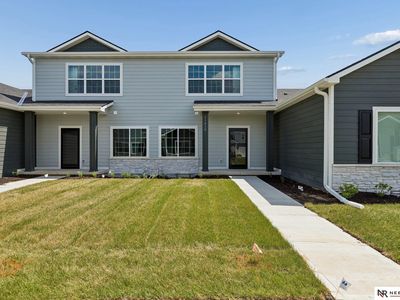
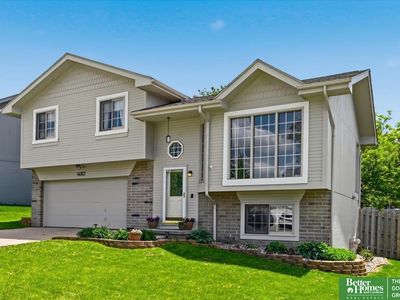
1165 S Kate AveFremontNE68025
INVESTMENT ANALYSIS
Investment Verdict
Solid IncomeAt $344,500, 1165 S Kate Ave, Fremont, NE, 68025 in Fremont generates $2,402/mo in rent (8.37% yield) but nets only $76/mo after debt service. The spread is thin, manageable for investors comfortable with low-margin holds who are buying into the 5% annual appreciation thesis. Ziffy Mortgage's DSCR loan (1.55) allows non-U.S. residents to acquire without personal income checks. A larger down payment reduces the monthly debt load and widens the margin. Five-year appreciation: $95,179. Total projected return: $136,345.
| This Property | City Avg | |
|---|---|---|
| Gross Rental Yield | 8.4% | 5.8% |
| Monthly Cash Flow | $76 | $850 |
City averages based on Fremont market data in our database. Property projections are estimates.
DSCR Rental Loan Qualification
Qualifies using the property's rental income, not your personal income.
- ✓No W-2, pay stubs, or tax returns needed
- ✓Rental income qualifies you
- ✓Built for real estate investors
| Monthly Rental Income | $2,402 |
| Total Monthly Debt Service | $2,189 |
| DSCR Ratio | 1.10x |
Ziffy Mortgage: Your DSCR most likely meets our 1.0+ requirement, so you'll most probably qualify for our standard DSCR investment loan program. To pre-qualify, book time with your loan officer →
Estimates assume 6.0% rate / 30-yr fixed, 30% down, 1% tax, 0.5% insurance. Not a commitment to lend.
Townhouse
Built in 2024
6,098 sqft lot
$N/A/sqft
No HOA
Neighborhood Data
Neighborhood data shown for ZIP Code: 68025, Fremont, NE area.
Housing Distribution
Housing Statistics
| Category | Value |
|---|---|
| Total HU (Housing Units) | 14,204 (100%) |
| Owner Occupied HU | 8,022 (56.5%) |
| Renter Occupied HU | 4,702 (33.1%) |
| Vacant Housing Units | 1,480 (10.4%) |
| Median Home Value | $219,293 |
| Average Home Value | $268,205 |
Housing Distribution
Address Breakdown
Residential
13,975
Single Family
13,006
Multi-Family
969
Businesses
1,043


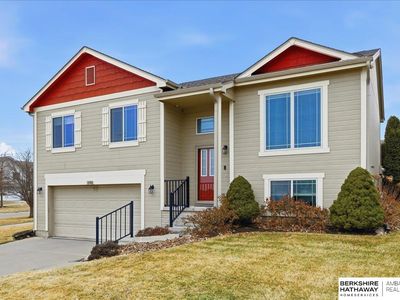
Nearby investment properties with comparable rents
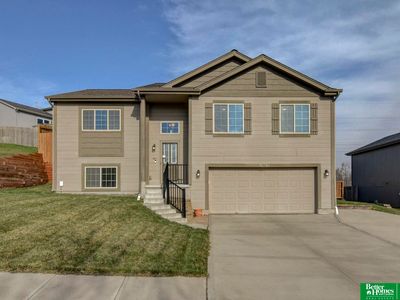
Nearby investment properties with comparable prices

Ziffy AI Summary
A quick, investor-focused snapshot highlighting income strength, yield potential.
| Key metrics | Value |
|---|---|
| Price | $399,900 |
| Est. Rent | $3,200/mo |
| ROI | 18% |
- Attractive rent-to-price ratio for income stability
- Good fit for DSCR financing with healthy coverage
Townhouse
Built in 2024
6,098 sqft lot
$N/A/sqft
No HOA
Neighborhood Data
Neighborhood data shown for ZIP Code: 68025, Fremont, NE area.
Housing Distribution
Housing Statistics
| Category | Value |
|---|---|
| Total HU (Housing Units) | 14,204 (100%) |
| Owner Occupied HU | 8,022 (56.5%) |
| Renter Occupied HU | 4,702 (33.1%) |
| Vacant Housing Units | 1,480 (10.4%) |
| Median Home Value | $219,293 |
| Average Home Value | $268,205 |
Housing Distribution
Address Breakdown
Residential
13,975
Single Family
13,006
Multi-Family
969
Businesses
1,043
Nearby investment properties with comparable rents
Nearby investment properties with comparable prices