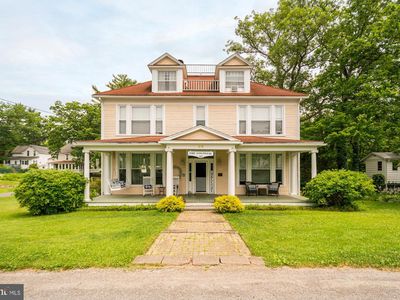
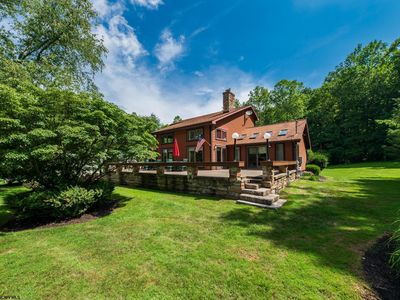
113 G StOaklandMD21550
INVESTMENT ANALYSIS
Investment Verdict
Steady Equity BuilderCapital preservation and steady income define 113 G St, Oakland, MD, 21550 in Oakland. Rental yield 7.14%. The 1.32 coverage passes Ziffy Mortgage's DSCR threshold for non-U.S. residents. Five-year appreciation of $137,865 and $4,596/yr in principal reduction project total return of $180,551.
| This Property | City Avg | |
|---|---|---|
| Gross Rental Yield | 7.1% | 5.8% |
| Monthly Cash Flow | $(136) | $750 |
City averages based on Oakland market data in our database. Property projections are estimates.
DSCR Rental Loan Qualification
Qualifies using the property's rental income, not your personal income.
- ✓No W-2, pay stubs, or tax returns needed
- ✓Rental income qualifies you
- ✓Built for real estate investors
| Monthly Rental Income | $2,968 |
| Total Monthly Debt Service | $2,905 |
| DSCR Ratio | 1.02x |
Ziffy Mortgage: Your DSCR most likely meets our 1.0+ requirement, so you'll most probably qualify for our standard DSCR investment loan program. To pre-qualify, book time with your loan officer →
Estimates assume 6.0% rate / 30-yr fixed, 30% down, 1% tax, 0.5% insurance. Not a commitment to lend.
Single Family
Built in 1903
0.28 Acres lot
$N/A/sqft
No HOA
Neighborhood Data
Neighborhood data shown for ZIP Code: 21550, Oakland, MD area.
Housing Distribution
Housing Statistics
| Category | Value |
|---|---|
| Total HU (Housing Units) | 8,200 (100%) |
| Owner Occupied HU | 4,452 (54.3%) |
| Renter Occupied HU | 1,331 (16.2%) |
| Vacant Housing Units | 2,417 (29.5%) |
| Median Home Value | $269,200 |
| Average Home Value | $353,393 |
Housing Distribution
Address Breakdown
Residential
6,713
Single Family
6,415
Multi-Family
298
Businesses
688


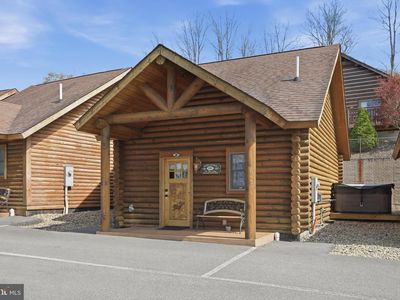
Nearby investment properties with comparable rents
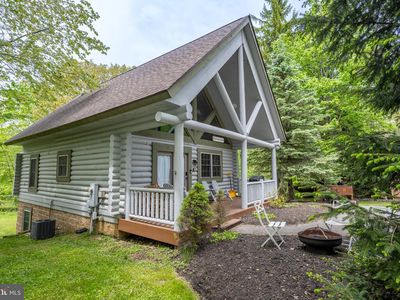
Nearby investment properties with comparable prices

Ziffy AI Summary
A quick, investor-focused snapshot highlighting income strength, yield potential.
| Key metrics | Value |
|---|---|
| Price | $399,900 |
| Est. Rent | $3,200/mo |
| ROI | 18% |
- Attractive rent-to-price ratio for income stability
- Good fit for DSCR financing with healthy coverage
Single Family
Built in 1903
0.28 Acres lot
$N/A/sqft
No HOA
Neighborhood Data
Neighborhood data shown for ZIP Code: 21550, Oakland, MD area.
Housing Distribution
Housing Statistics
| Category | Value |
|---|---|
| Total HU (Housing Units) | 8,200 (100%) |
| Owner Occupied HU | 4,452 (54.3%) |
| Renter Occupied HU | 1,331 (16.2%) |
| Vacant Housing Units | 2,417 (29.5%) |
| Median Home Value | $269,200 |
| Average Home Value | $353,393 |
Housing Distribution
Address Breakdown
Residential
6,713
Single Family
6,415
Multi-Family
298
Businesses
688
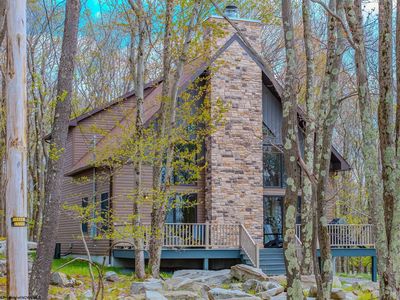
Nearby investment properties with comparable rents
Nearby investment properties with comparable prices