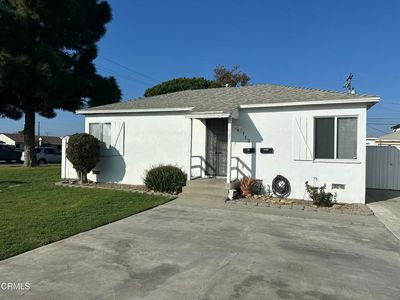
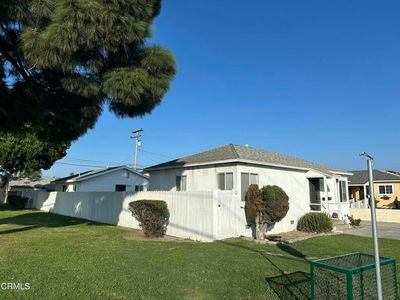
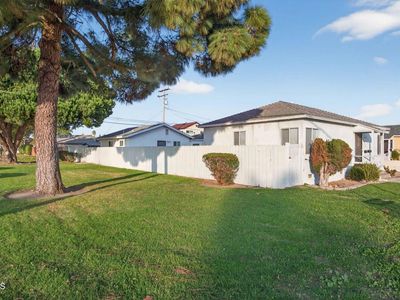
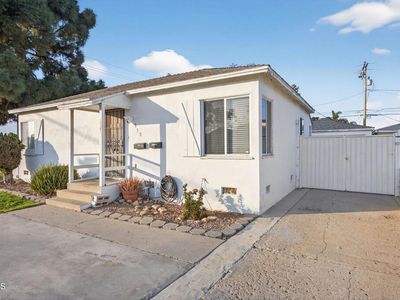
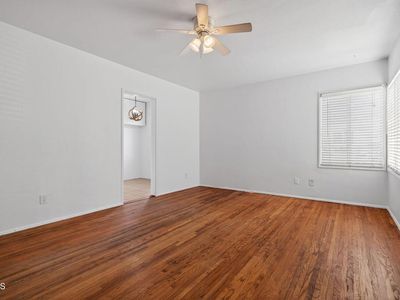
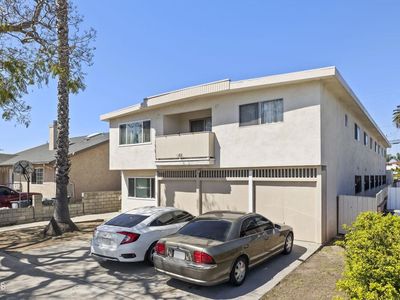
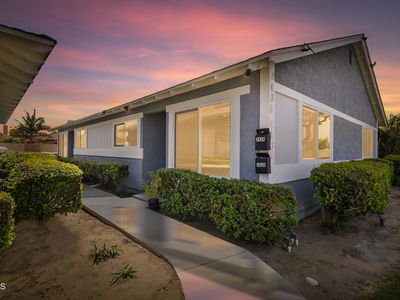
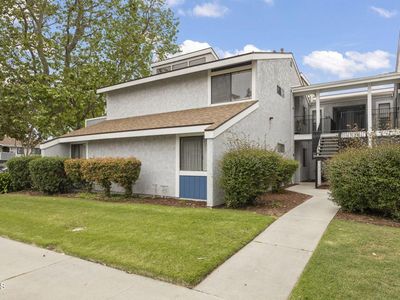
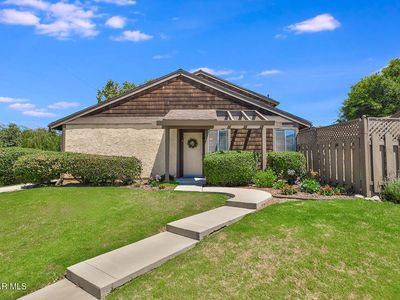
113 E Cedar StOxnardCA93033


Nearby investment properties with comparable rents
Nearby investment properties with comparable prices

Ziffy AI Summary
A quick, investor-focused snapshot highlighting income strength, yield potential.
| Key metrics | Value |
|---|---|
| Price | $399,900 |
| Est. Rent | $3,200/mo |
| ROI | 18% |
- Attractive rent-to-price ratio for income stability
- Good fit for DSCR financing with healthy coverage
Investment Highlights
Investment property for sale in Oxnard at 113 E Cedar St, Oxnard, CA, 93033 with 5% annual appreciation on a $670,000 basis while $2,839/mo rent supports operations. 95% in year one. Equity gained on principal adds $4,323/yr, and five-year appreciation sums $185,109 alongside rental yield of 5.08%. Five-year ROI measures 65.51% and total cumulative return in cash totals $144,401. Investors can finance this property with Ziffy Mortgage’s DSCR loan that underwrites to $2,839/mo property income versus a $3,279/mo payment rather than your W2s, Paystubs, Tax returns, or 1099 forms.
Single Family
Built in 1944
6,098 sqft lot
$N/A/sqft
No HOA
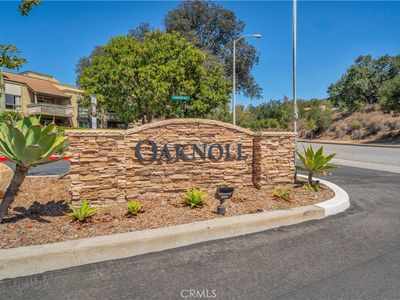
Neighborhood Data
Neighborhood data shown for ZIP Code: 93033, Oxnard, CA area.
Housing Distribution
Housing Statistics
| Category | Value |
|---|---|
| Total HU (Housing Units) | 17,924 (100%) |
| Owner Occupied HU | 9,880 (55.1%) |
| Renter Occupied HU | 7,599 (42.4%) |
| Vacant Housing Units | 445 ( 2.5%) |
| Median Home Value | $574,675 |
| Average Home Value | $598,320 |
Housing Distribution
Address Breakdown
Residential
17,300
Single Family
15,320
Multi-Family
1,980
Businesses
1,107
Nearby investment properties with comparable rents
Nearby investment properties with comparable prices
Listed by: Donna Neece • RESOURCE REAL ESTATE
Mls Name: CRMLS
Mls ID: #V1-33756