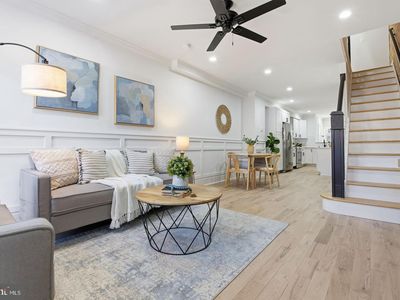
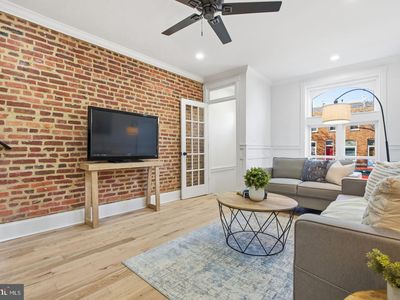
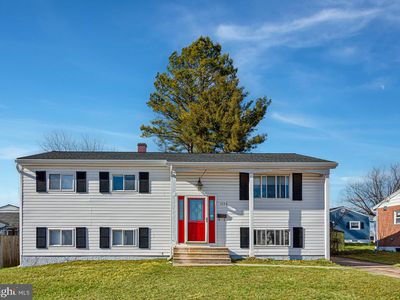
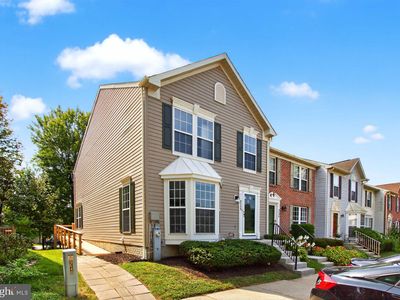
1126 E Fort AveBaltimoreMD21230

INVESTMENT ANALYSIS
Investment Verdict
Solid Income1126 E Fort Ave, Baltimore, MD, 21230 in Baltimore is a solid income-producing rental, 9.04% gross yield, $4,631/mo rent, $806/mo net cash flow on a $615,000 buy. DSCR 1.67 qualifies the property for Ziffy Mortgage's financing without personal income documentation. Five-year appreciation of $169,913 and $5,664/yr in principal reduction project a total cumulative return of $285,206.
| This Property | City Avg | |
|---|---|---|
| Gross Rental Yield | 9% | 4.8% |
| Monthly Cash Flow | $806 | $850 |
City averages based on Baltimore market data in our database. Property projections are estimates.
DSCR Rental Loan Qualification
Qualifies using the property's rental income, not your personal income.
- ✓No W-2, pay stubs, or tax returns needed
- ✓Rental income qualifies you
- ✓Built for real estate investors
| Monthly Rental Income | $4,631 |
| Total Monthly Debt Service | $3,580 |
| DSCR Ratio | 1.29x |
Ziffy Mortgage: Your DSCR most likely meets our 1.0+ requirement, so you'll most probably qualify for our standard DSCR investment loan program. To pre-qualify, book time with your loan officer →
Estimates assume 6.0% rate / 30-yr fixed, 30% down, 1% tax, 0.5% insurance. Not a commitment to lend.
Townhouse
Built in 1880
952 sqft lot
$N/A/sqft
No HOA
Neighborhood Data
Neighborhood data shown for ZIP Code: 21230, Baltimore, MD area.
Housing Distribution
Housing Statistics
| Category | Value |
|---|---|
| Total HU (Housing Units) | 20,297 (100%) |
| Owner Occupied HU | 8,217 (40.5%) |
| Renter Occupied HU | 9,114 (44.9%) |
| Vacant Housing Units | 2,966 (14.6%) |
| Median Home Value | $366,297 |
| Average Home Value | $389,487 |
Housing Distribution
Address Breakdown
Residential
18,842
Single Family
14,501
Multi-Family
4,341
Businesses
1,495


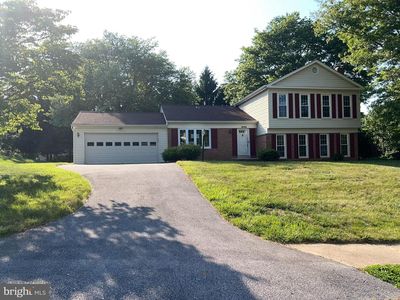
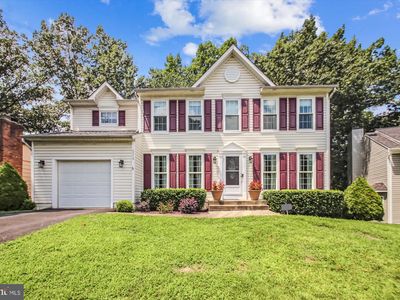
Nearby investment properties with comparable rents
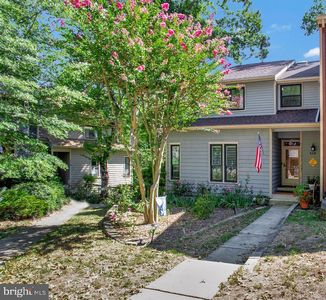
Nearby investment properties with comparable prices

Ziffy AI Summary
A quick, investor-focused snapshot highlighting income strength, yield potential.
| Key metrics | Value |
|---|---|
| Price | $399,900 |
| Est. Rent | $3,200/mo |
| ROI | 18% |
- Attractive rent-to-price ratio for income stability
- Good fit for DSCR financing with healthy coverage
Townhouse
Built in 1880
952 sqft lot
$N/A/sqft
No HOA
Neighborhood Data
Neighborhood data shown for ZIP Code: 21230, Baltimore, MD area.
Housing Distribution
Housing Statistics
| Category | Value |
|---|---|
| Total HU (Housing Units) | 20,297 (100%) |
| Owner Occupied HU | 8,217 (40.5%) |
| Renter Occupied HU | 9,114 (44.9%) |
| Vacant Housing Units | 2,966 (14.6%) |
| Median Home Value | $366,297 |
| Average Home Value | $389,487 |
Housing Distribution
Address Breakdown
Residential
18,842
Single Family
14,501
Multi-Family
4,341
Businesses
1,495
Nearby investment properties with comparable rents
Nearby investment properties with comparable prices