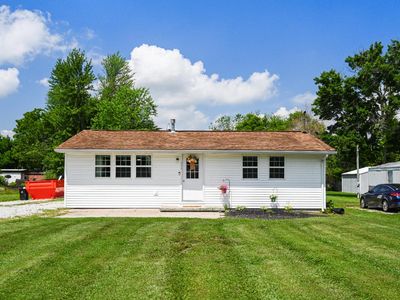
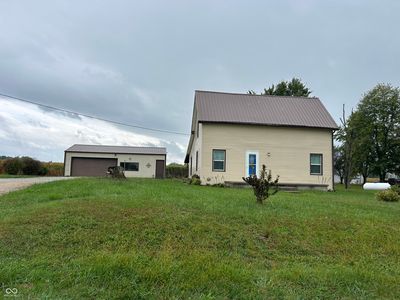
111 Harlan StOsgoodIN47037

INVESTMENT ANALYSIS
Investment Verdict
Steady Equity Builder111 Harlan St, Osgood, IN, 47037 in Osgood earns a respectable 7.67% gross yield at $179,900, but after the $809/mo mortgage the net cash flow is $70/mo, a tight but positive spread. Expense discipline (vacancy, management, maintenance) will determine whether the margin widens. Ziffy Mortgage's DSCR mortgage (1.42) still qualifies on property income; a larger down payment can improve the cash-flow buffer. Long-term, 5% appreciation projects $49,703 over five years, making equity the dominant return driver. Total projected return: $72,598.
| This Property | City Avg | |
|---|---|---|
| Gross Rental Yield | 7.7% | 6.0% |
| Monthly Cash Flow | $70 | $150 |
City averages based on Osgood market data in our database. Property projections are estimates.
DSCR Rental Loan Qualification
Qualifies using the property's rental income, not your personal income.
- ✓No W-2, pay stubs, or tax returns needed
- ✓Rental income qualifies you
- ✓Built for real estate investors
| Monthly Rental Income | $1,150 |
| Total Monthly Debt Service | $1,008 |
| DSCR Ratio | 1.14x |
Ziffy Mortgage: Your DSCR most likely meets our 1.0+ requirement, so you'll most probably qualify for our standard DSCR investment loan program. To pre-qualify, book time with your loan officer →
Estimates assume 6.0% rate / 30-yr fixed, 30% down, 1% tax, 0.5% insurance. Not a commitment to lend.
Single Family
Built in 1957
0.25 Acres lot
$N/A/sqft
No HOA
Neighborhood Data
Neighborhood data shown for ZIP Code: 47037, Osgood, IN area.
Housing Distribution
Housing Statistics
| Category | Value |
|---|---|
| Total HU (Housing Units) | 1,859 (100%) |
| Owner Occupied HU | 1,276 (68.6%) |
| Renter Occupied HU | 415 (22.3%) |
| Vacant Housing Units | 168 ( 9.0%) |
| Median Home Value | $261,161 |
| Average Home Value | $300,121 |
Housing Distribution
Address Breakdown
Residential
1,704
Single Family
1,668
Multi-Family
36
Businesses
105


Nearby investment properties with comparable rents


Nearby investment properties with comparable prices


Ziffy AI Summary
A quick, investor-focused snapshot highlighting income strength, yield potential.
| Key metrics | Value |
|---|---|
| Price | $399,900 |
| Est. Rent | $3,200/mo |
| ROI | 18% |
- Attractive rent-to-price ratio for income stability
- Good fit for DSCR financing with healthy coverage
Single Family
Built in 1957
0.25 Acres lot
$N/A/sqft
No HOA
Neighborhood Data
Neighborhood data shown for ZIP Code: 47037, Osgood, IN area.
Housing Distribution
Housing Statistics
| Category | Value |
|---|---|
| Total HU (Housing Units) | 1,859 (100%) |
| Owner Occupied HU | 1,276 (68.6%) |
| Renter Occupied HU | 415 (22.3%) |
| Vacant Housing Units | 168 ( 9.0%) |
| Median Home Value | $261,161 |
| Average Home Value | $300,121 |
Housing Distribution
Address Breakdown
Residential
1,704
Single Family
1,668
Multi-Family
36
Businesses
105
Nearby investment properties with comparable rents
Nearby investment properties with comparable prices