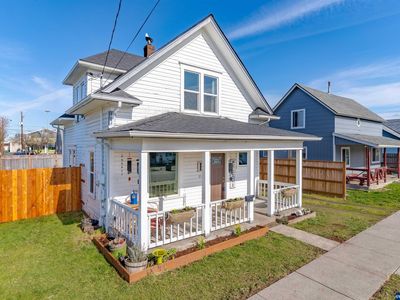
1049 Fernwood Ct NWSalemOR97304

INVESTMENT ANALYSIS
Investment Verdict
Strong Cash Flow1049 Fernwood Ct NW, Salem, OR, 97304 in Salem is a top-tier cash-flow asset. At $388,700 it produces $3,421/mo in rent and $1,075/mo in net monthly income, a 10.56% gross rental yield. The DSCR of 1.96 qualifies for Ziffy Mortgage's DSCR loan without W-2s or U.S. credit history. Annual cash flow: $12,899. Five-year appreciation adds $107,391, driving a total cumulative return of $216,331.
| This Property | City Avg | |
|---|---|---|
| Gross Rental Yield | 10.6% | 5.8% |
| Monthly Cash Flow | $1,075 | $420 |
City averages based on Salem market data in our database. Property projections are estimates.
DSCR Loan Qualification
| Monthly Rental Income | $3,421 |
| Total Monthly Debt Service | $2,192 |
| DSCR Ratio | 1.56x |
Ziffy Mortgage: Your DSCR most likely meets our 1.0+ requirement, so you'll most probably qualify for our standard DSCR investment loan program. To pre-qualify, book time with your loan officer →
Estimates assume 6.0% rate / 30-yr fixed, 30% down, 1% tax, 0.5% insurance. Not a commitment to lend.
Single Family
Built in 1980
6,969 sqft lot
$N/A/sqft
No HOA
Neighborhood Data
Neighborhood data shown for ZIP Code: 97304, Salem, OR area.
Housing Distribution
Housing Statistics
| Category | Value |
|---|---|
| Total HU (Housing Units) | 14,298 (100%) |
| Owner Occupied HU | 9,012 (63.0%) |
| Renter Occupied HU | 4,744 (33.2%) |
| Vacant Housing Units | 542 ( 3.8%) |
| Median Home Value | $502,291 |
| Average Home Value | $545,006 |
Housing Distribution
Address Breakdown
Residential
13,298
Single Family
12,487
Multi-Family
811
Businesses
616


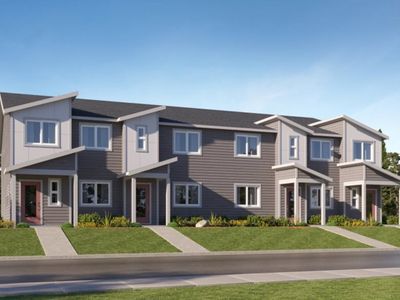
Nearby investment properties with comparable rents
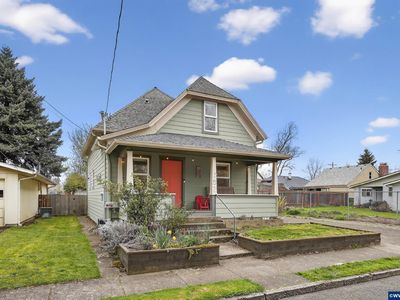
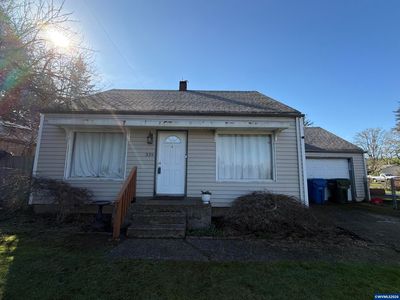
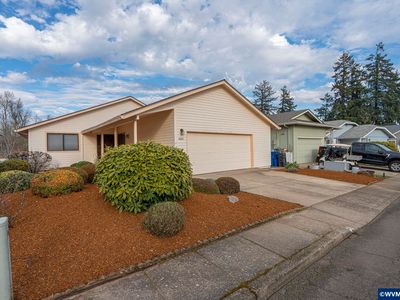
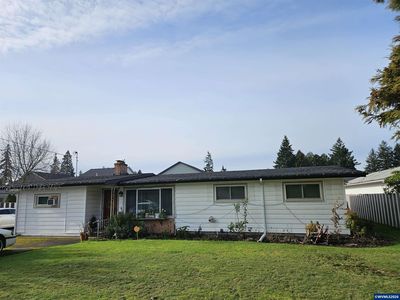
Nearby investment properties with comparable prices
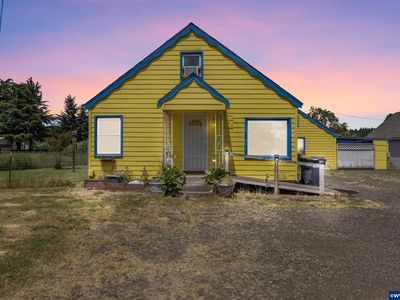

Ziffy AI Summary
A quick, investor-focused snapshot highlighting income strength, yield potential.
| Key metrics | Value |
|---|---|
| Price | $399,900 |
| Est. Rent | $3,200/mo |
| ROI | 18% |
- Attractive rent-to-price ratio for income stability
- Good fit for DSCR financing with healthy coverage
Single Family
Built in 1980
6,969 sqft lot
$N/A/sqft
No HOA
Neighborhood Data
Neighborhood data shown for ZIP Code: 97304, Salem, OR area.
Housing Distribution
Housing Statistics
| Category | Value |
|---|---|
| Total HU (Housing Units) | 14,298 (100%) |
| Owner Occupied HU | 9,012 (63.0%) |
| Renter Occupied HU | 4,744 (33.2%) |
| Vacant Housing Units | 542 ( 3.8%) |
| Median Home Value | $502,291 |
| Average Home Value | $545,006 |
Housing Distribution
Address Breakdown
Residential
13,298
Single Family
12,487
Multi-Family
811
Businesses
616
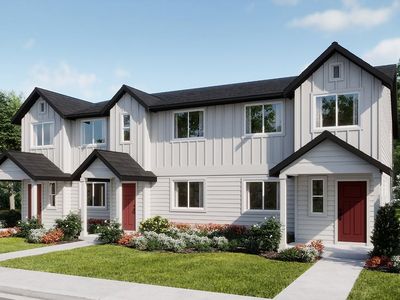
Nearby investment properties with comparable rents
Nearby investment properties with comparable prices