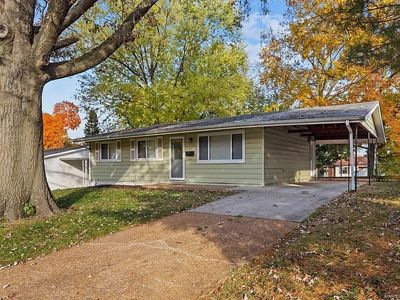
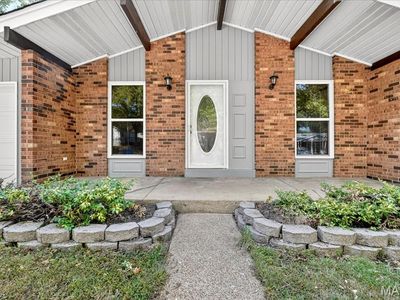
1040 Bluefield DrFlorissantMO63033
INVESTMENT ANALYSIS
Investment Verdict
Appreciation PlayMarkets with strong demand fundamentals often produce low-yield, high-appreciation assets. 1040 Bluefield Dr, Florissant, MO, 63033 in Florissant fits: $550,000, 3.98% gross yield, and a projected 5% annual appreciation rate adding $151,955 in value within five years. Rental yield 3.98%. The narrow rent-to-debt spread is the trade-off for market growth. Ziffy Mortgage's DSCR loan (0.74) finances non-U.S. buyers without personal income documentation; optimise coverage with a 30–35% down payment. $5,066/yr in principal paydown and $151,955 in appreciation project a total return of $105,678.
| This Property | City Avg | |
|---|---|---|
| Gross Rental Yield | 4% | 6.8% |
| Monthly Cash Flow | $(1,600) | $450 |
City averages based on Florissant market data in our database. Property projections are estimates.
DSCR Rental Loan Qualification
Qualifies using the property's rental income, not your personal income.
- ✓No W-2, pay stubs, or tax returns needed
- ✓Rental income qualifies you
- ✓Built for real estate investors
| Monthly Rental Income | $1,825 |
| Total Monthly Debt Service | $3,206 |
| DSCR Ratio | 0.57x |
Ziffy Mortgage typically prefers a DSCR of 1.0+, but in some cases you may qualify with a DSCR below 1. To explore if this deal qualifies for an investment mortgage, book time with your loan officer →
Estimates assume 6.0% rate / 30-yr fixed, 30% down, 1% tax, 0.5% insurance. Not a commitment to lend.
Single Family
Built in 1958
7,501 sqft lot
$N/A/sqft
No HOA
Neighborhood Data
Neighborhood data shown for ZIP Code: 63033, Florissant, MO area.
Housing Distribution
Housing Statistics
| Category | Value |
|---|---|
| Total HU (Housing Units) | 18,341 (100%) |
| Owner Occupied HU | 10,869 (59.3%) |
| Renter Occupied HU | 5,935 (32.4%) |
| Vacant Housing Units | 1,537 ( 8.4%) |
| Median Home Value | $164,599 |
| Average Home Value | $182,286 |
Housing Distribution
Address Breakdown
Residential
17,409
Single Family
14,466
Multi-Family
2,943
Businesses
639


Nearby investment properties with comparable rents
Nearby investment properties with comparable prices

Ziffy AI Summary
A quick, investor-focused snapshot highlighting income strength, yield potential.
| Key metrics | Value |
|---|---|
| Price | $399,900 |
| Est. Rent | $3,200/mo |
| ROI | 18% |
- Attractive rent-to-price ratio for income stability
- Good fit for DSCR financing with healthy coverage
Single Family
Built in 1958
7,501 sqft lot
$N/A/sqft
No HOA
Neighborhood Data
Neighborhood data shown for ZIP Code: 63033, Florissant, MO area.
Housing Distribution
Housing Statistics
| Category | Value |
|---|---|
| Total HU (Housing Units) | 18,341 (100%) |
| Owner Occupied HU | 10,869 (59.3%) |
| Renter Occupied HU | 5,935 (32.4%) |
| Vacant Housing Units | 1,537 ( 8.4%) |
| Median Home Value | $164,599 |
| Average Home Value | $182,286 |
Housing Distribution
Address Breakdown
Residential
17,409
Single Family
14,466
Multi-Family
2,943
Businesses
639
Nearby investment properties with comparable rents
Nearby investment properties with comparable prices
Listed by: Igal Alon • STL Smart Realty
Mls Name: MARIS
Mls Provider:
Mls ID: #25024023
Disclaimer: IDX information is provided exclusively for personal, non-commercial use, and may not be used for any purpose other than to identify prospective properties consumers may be interested in purchasing. Information is deemed reliable but not guaranteed. Some IDX listings have been excluded from this website. [Click here for more information](/mls-disclaimers/#197)