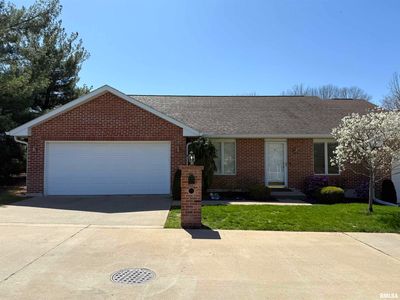
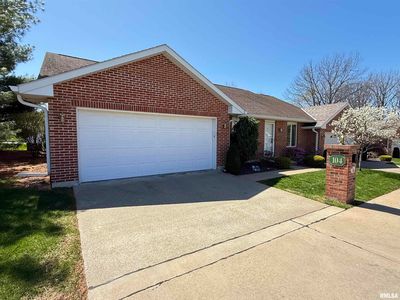
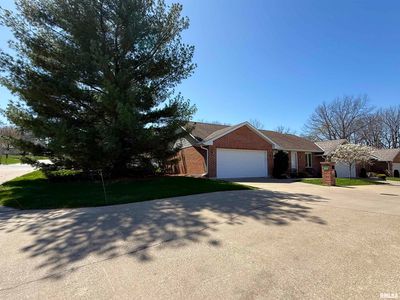
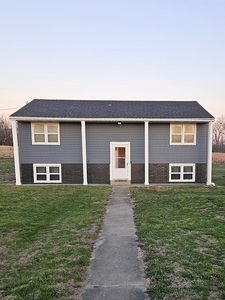
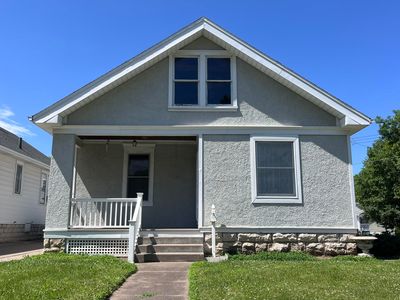
104 Waterford Dr WQuincyIL62305
INVESTMENT ANALYSIS
Investment Verdict
Strong Cash FlowThis is a cash-flow-light asset: 104 Waterford Dr W, Quincy, IL, 62305 in Quincy, $235,000, 10.22% gross yield, $172/mo net income. Consider it a market-entry position, the $2,002/mo rent covers the $1,057/mo payment with a margin, and 5%/yr appreciation is projected to add $64,926 to the asset's value over five years. Ziffy Mortgage approves DSCR loans (coverage 1.89) for non-U.S. residents without domestic income documentation. Consider a higher down payment to widen the monthly margin. Total projected return: $101,840.
| This Property | City Avg | |
|---|---|---|
| Gross Rental Yield | 10.2% | 6.5% |
| Monthly Cash Flow | $172 | $300 |
City averages based on Quincy market data in our database. Property projections are estimates.
DSCR Rental Loan Qualification
Qualifies using the property's rental income, not your personal income.
- ✓No W-2, pay stubs, or tax returns needed
- ✓Rental income qualifies you
- ✓Built for real estate investors
| Monthly Rental Income | $2,002 |
| Total Monthly Debt Service | $1,737 |
| DSCR Ratio | 1.15x |
Ziffy Mortgage: Your DSCR most likely meets our 1.0+ requirement, so you'll most probably qualify for our standard DSCR investment loan program. To pre-qualify, book time with your loan officer →
Estimates assume 6.0% rate / 30-yr fixed, 30% down, 1% tax, 0.5% insurance. Not a commitment to lend.
Townhouse
Built in 1991
N/A lot
$N/A/sqft
$200 monthly HOA
Neighborhood Data
Neighborhood data shown for ZIP Code: 62305, Quincy, IL area.
Housing Distribution
Housing Statistics
| Category | Value |
|---|---|
| Total HU (Housing Units) | 8,511 (100%) |
| Owner Occupied HU | 6,567 (77.2%) |
| Renter Occupied HU | 1,393 (16.4%) |
| Vacant Housing Units | 551 ( 6.5%) |
| Median Home Value | $233,541 |
| Average Home Value | $257,294 |
Housing Distribution
Address Breakdown
Residential
8,078
Single Family
7,857
Multi-Family
221
Businesses
647


Nearby investment properties with comparable rents
Nearby investment properties with comparable prices

Ziffy AI Summary
A quick, investor-focused snapshot highlighting income strength, yield potential.
| Key metrics | Value |
|---|---|
| Price | $399,900 |
| Est. Rent | $3,200/mo |
| ROI | 18% |
- Attractive rent-to-price ratio for income stability
- Good fit for DSCR financing with healthy coverage
Townhouse
Built in 1991
N/A lot
$N/A/sqft
$200 monthly HOA
Neighborhood Data
Neighborhood data shown for ZIP Code: 62305, Quincy, IL area.
Housing Distribution
Housing Statistics
| Category | Value |
|---|---|
| Total HU (Housing Units) | 8,511 (100%) |
| Owner Occupied HU | 6,567 (77.2%) |
| Renter Occupied HU | 1,393 (16.4%) |
| Vacant Housing Units | 551 ( 6.5%) |
| Median Home Value | $233,541 |
| Average Home Value | $257,294 |
Housing Distribution
Address Breakdown
Residential
8,078
Single Family
7,857
Multi-Family
221
Businesses
647
Nearby investment properties with comparable rents
Nearby investment properties with comparable prices
Listed by: Luke Tappe • Davis & Frese, Inc., REALTORS
Mls Name: RMLS Alliance
Mls Provider:
Mls ID: #CA1035567
Disclaimer: IDX information is provided exclusively for personal, non-commercial use, and may not be used for any purpose other than to identify prospective properties consumers may be interested in purchasing. Information is deemed reliable but not guaranteed.