


Editorial Integrity
Making sound real estate investment decisions begins with reliable, data-driven insights. At Ziffy.ai, we offer an AI-powered investment property search platform, proprietary data-driven trend analysis, investment mortgage programs like DSCR loans, and a network of over 500 investor-friendly real estate agents to deliver the expertise needed for informed decisions. Our content is crafted by experienced real estate professionals and backed by real-time market data, ensuring you receive accurate and actionable information. Through a rigorous editorial process, we strive to empower your investment journey with trustworthy and up-to-date guidance.
Mortgage rates had just fallen below 6%, a threshold many economists viewed as critical for reviving activity in the U.S. housing market. Then conditions shifted.
In early March 2026, escalating geopolitical tensions linked to the U.S.-Iran crisis coincided with increased volatility across global financial markets. As investors reacted to rising uncertainty across global markets, U.S. Treasury yields increased, reflecting a shift in expectations across bond markets.
Mortgage rates tend to follow movements in the 10-year Treasury yield, which serves as a benchmark for long-term borrowing costs. From February 27 to March 6, 2026, the 10-year yield rose from approximately 3.97% to 4.15% (+18 basis points), which corresponded with higher mortgage rates during the same period.
During this period, borrowing costs increased, with mortgage rates crossing back above 6% in early March. Freddie Mac’s Primary Mortgage Market Survey reported an average 30-year rate of 5.98% for the week of February 26, 2026, while Mortgage News Daily’s daily index showed rates at 6.13% by March 3.
For buyers already in the process, even a modest rate move can quickly change the cost outlook. Ziffy.ai analyzed typical home values across all 50 states and Washington, D.C., to estimate how this shift affected borrowing costs.
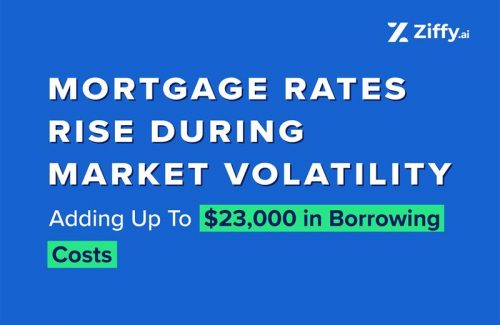
At the national typical home value, the increase translates to about $28 more per month on a 30-year fixed mortgage with 20% down, roughly $10,000 in additional interest over the life of the loan. In higher-priced housing markets, the added cost can exceed $23,000.
Table of Contents
The March Rate Move That Hit at the Start of Spring Buying Season
Mortgage rates had been easing for weeks heading into March, with Freddie Mac noting late-February declines were beginning to lift purchase applications and refinance activity, signs that a stronger spring market might be taking shape.
That momentum quickly gave way to uncertainty once rates reversed.
By early March, Mortgage News Daily’s daily index had moved back above 6%, and housing analysts warned that renewed volatility could delay buyer activity. Bright MLS Chief Economist Lisa Sturtevant told Real Estate News that “the beginning of the spring homebuying season could be delayed as buyers wait for mortgage rates to settle back down.”
The timing of this rate increase is notable, as it comes just as the spring homebuying season begins, when buyer activity typically accelerates.
This analysis does not suggest that geopolitical events alone determine mortgage rates. Instead, it measures how borrowing costs changed for a typical buyer during that early-March rate move, and how those costs vary depending on local home values.
This increase comes at a time when entry-level housing supply is already tightening across many U.S. markets, further compounding affordability pressures for first-time buyers.
The findings show that even modest rate movements can translate into thousands of dollars in additional borrowing costs, particularly in higher-priced housing markets.
Key Highlights
-
 $10,000 added to the typical U.S. mortgage from a 0.15-point rate increase
At the national typical home value of $359,078, monthly payments rose by about $28, increasing total borrowing costs by roughly $9,999 over a 30-year loan. - High-cost states like Hawaii see over $23,000 in added borrowing costs
Higher-priced markets see the largest increases in borrowing costs, with Hawaii buyers paying about $66 more per month, or $23,639 in additional lifetime interest. - Monthly payment increases vary by as much as 5× across states
From about $13 in West Virginia to $66 in Hawaii, the monthly payment increases scale sharply with home values. - 39 states see monthly payment increases of $20 or more
Across most U.S. markets, even modest rate increases translate into measurable changes in monthly borrowing costs, with 9 states seeing increases above $40. - California buyers face over $21,000 in additional borrowing costs
A typical California homebuyer sees monthly payments rise by about $59, adding roughly $21,185 in total interest over the life of a 30-year loan. - Monthly costs rise 1.6%, tightening buyer qualification margins
At the national level, the increase raises payments by about 1.6%, which can affect qualification for borrowers already near lender underwriting limits. - The Rate move disrupted sub-6% momentum heading into the spring season
Mortgage rates dipped below 6% for the first time since 2022 before reversing in early March, stalling early spring momentum.
Top 10 States Where the Early-March Rate Increase Hits Buyers the Hardest
Because the rate increase applied broadly across markets, the impact varies primarily with home values and loan sizes, with higher-priced markets seeing the largest increases in borrowing costs.
The table below highlights the states with the largest increases in borrowing costs following the early-March rate move.
Note: Lifetime cost increases are calculated using full amortization schedules and may differ slightly from a simple multiple of the rounded monthly payment difference.

Amresh Singh
Founder and CEOZiffy.ai
What the Rate Move Means for the Typical American Homebuyer
Mortgage rate increases raise borrowing costs for homebuyers across the country.
In early March 2026, the average 30-year mortgage rate moved from 5.98% to 6.13%. For a buyer purchasing at the national typical home value of $359,078, that change increases the monthly principal-and-interest payment from about $1,719 to $1,746.
That difference, about $28 per month, results in approximately $9,999 in additional interest over a 30-year mortgage.
Metric | Value |
|---|---|
Typical Home Value | $359,078 |
Loan Amount (20% down) | $287,262 |
Monthly Payment at 5.98% | $1,719 |
Monthly Payment at 6.13% | $1,746 |
Monthly Increase | $28 |
Estimated 30-Year Interest Increase | $9,999 |
Even a relatively small rate move can translate into thousands of dollars in additional borrowing costs over time.
The Largest Cost Increases Occur in the Most Expensive Housing Markets
Because the rate increase applies broadly across markets, the impact depends primarily on loan size.
Larger mortgages experience larger payment increases. As a result, higher-priced housing markets see the biggest increases in borrowing costs.
The largest increases occur in Hawaii, California, Massachusetts, the District of Columbia, and Washington, markets where typical home values exceed $600,000.
States | Typical Home Value | Loan Amount | Monthly Payment Increase | Lifetime Cost Increase |
|---|---|---|---|---|
Hawaii | $848,926 | $679,141 | $66 | $23,639 |
California | $760,800 | $608,640 | $59 | $21,185 |
Massachusetts | $635,252 | $508,202 | $49 | $17,689 |
District of Columbia | $606,163 | $484,930 | $47 | $16,879 |
Washington | $603,837 | $483,070 | $47 | $16,814 |
Buyers in higher-priced markets see monthly increases that are two to five times larger than those in lower-cost states, for example, about $66 per month in Hawaii compared to $13 in West Virginia.
The Same Rate Move Produces Very Different Costs Across States
Across the country, the added monthly cost ranges from about $13 in West Virginia to $66 in Hawaii, a roughly five-fold difference driven by variations in home prices.
In lifetime terms, that translates to approximately $4,700 in additional interest over 30 years in West Virginia, compared with about $23,600 in Hawaii.
Even in the lowest-cost housing markets, the increase still represents several thousand dollars in additional borrowing costs.
States | Typical Home Value | Loan Amount | Monthly Payment Increase | Lifetime Cost Increase |
|---|---|---|---|---|
West Virginia | $169,759 | $135,807 | $13 | $4,727 |
Oklahoma | $186,397 | $149,118 | $14 | $5,190 |
Louisiana | $189,849 | $151,879 | $15 | $5,286 |
Mississippi | $213,371 | $170,697 | $17 | $5,941 |
Ohio | $218,822 | $175,058 | $17 | $6,093 |
Note: Lifetime cost increases reflect the exact amortization impact of the rate change and are not calculated as a simple multiple of the rounded monthly difference.
Where Buyers Are Most at Risk From Rate Increases
While higher-priced states see the largest dollar increases, the impact of rising mortgage rates is not uniform when viewed through the lens of local incomes and affordability.
In lower- and mid-priced markets, even modest payment increases can have an outsized effect on buyers operating near qualification limits. A $20-$30 increase may appear small in absolute terms, but for borrowers already close to lender thresholds, even minor changes in monthly obligations can influence loan eligibility.
For example, a $20–$30 monthly increase may appear modest in absolute terms, but can push borrowers already near lender underwriting limits; even a small payment increase can affect qualification. Exact allowable DTIs vary widely by loan type, underwriting system, credit profile, and compensating factors.
This sensitivity is often more pronounced in markets with:
- lower median household incomes
- tighter affordability margins
- and a higher reliance on financing
As a result, the buyers most exposed to rate increases are not always in the most expensive states, but in markets where affordability is already stretched and financial flexibility is limited
Exact allowable debt-to-income ratios vary by loan type, underwriting system, and borrower profile, but the underlying dynamic remains consistent: when affordability is tight, even small rate movements can have disproportionate effects.
When a Small Rate Move Can Affect Mortgage Qualification
For many buyers, the biggest risk from a rate increase is not just a higher monthly payment, it’s whether the loan still qualifies.
At the national typical home value, the early-March rate move increases the monthly principal-and-interest payment by about 1.6%. While that may seem modest, it can matter for borrowers already near underwriting limits.
At the national level, the roughly $28 monthly increase represents about 0.4% of median household income, but the relative impact is higher in lower-income markets where affordability margins are tighter.
Many mortgage programs use debt-to-income (DTI) guidelines, with allowable ratios varying based on the loan program, credit profile, and other factors. As rates rise, higher monthly payments can push DTI ratios upward.
Consider a buyer earning $80,000 annually ($6,667 per month) with $1,140 in existing monthly debts, purchasing at the national typical home value.
At a 5.98% rate, the borrower’s DTI is 42.9%, just below a common qualification range. At 6.13%, the ratio rises to 43.3%, which may affect qualification depending on the loan program and borrower profile.
For households already stretching to buy a home, even a small rate change can determine whether a loan is approved.

Debjit Saha
Co-Founder and CTOZiffy.ai
Examples of the Largest Mortgage Cost Increases by State
The impact of the early-March rate increase varies significantly across markets, with higher-cost states seeing the largest increases in borrowing costs. The examples below highlight how the same rate move translates differently depending on local home values, and what that means for buyers in those markets.
- Hawaii: Highest overall impact
At a typical home value of $848,926, a buyer financing about $679,141 sees monthly payments rise from $4,063 to $4,129, an increase of about $66 per month. That translates to roughly $23,639 in additional interest over 30 years, the largest increase nationally.
In already high-cost markets like Hawaii, even small rate changes can significantly worsen affordability and raise the barrier to entry for buyers. - California: Large impact in a high-demand market
With a typical home value of $760,800, monthly payments increase from $3,641 to $3,700, adding about $59 per month and approximately $21,185 over the life of the loan.
In competitive markets like California, rising borrowing costs can further stretch affordability and impact investment returns. - Massachusetts: Mid-$600K markets see meaningful increases
At a typical home value of $635,252, payments rise from $3,040 to $3,090, an increase of about $49 per month, or roughly $17,689 over 30 years.
Even in mid-to-high-priced markets, modest rate changes translate into substantial long-term costs for buyers. - District of Columbia: Urban markets face rising financing pressure
At $606,163, monthly payments increase from $2,901 to $2,948, adding about $47 per month and approximately $16,879 over the life of the loan.
In urban, high-income markets, rate increases can still affect affordability thresholds and buyer qualification. - Washington: High-growth markets see similar cost pressures
At a typical home value of $603,837, payments rise from $2,890 to $2,937, an increase of about $47 per month, or roughly $16,814 over 30 years.
In fast-growing housing markets, higher borrowing costs can slow demand and impact purchasing decisions.
These examples highlight how even small rate changes can have dramatically different financial impacts depending on local housing prices.
The Rate Impact in Every State: Complete Rankings
The table below shows how the early-March rate move affected homebuyers in all 50 U.S. states and Washington, D.C., ranked from highest to lowest.
The estimates reflect how a change in mortgage rates from 5.98% to 6.13% impacts monthly payments and total interest costs at each state’s typical home value.
The ranking highlights how differences in home prices drive variation in borrowing costs, even when the rate change itself is the same nationwide.
Methodology
Data Sources
Home Values: Zillow Home Value Index (ZHVI)
State-level typical home values are sourced from the Zillow Home Value Index (ZHVI) for all homes (single-family residences, condos, and co-ops), middle tier (35th–65th percentile), smoothed and seasonally adjusted.
Data vintage: January 2026
Values were extracted from the Federal Reserve Economic Data (FRED) database using Zillow’s state-level ZHVI series. The national typical home value used in this report is $359,078.
ZHVI represents the typical home value as the weighted average of homes in the middle third of the housing distribution. It differs from median sale price measures, which are based on transaction data.
Using the FRED series ensures consistency and reproducibility across all states.
Mortgage Rate Benchmarks
Pre-Move Rate: 5.98%
The baseline rate of 5.98% is sourced from Freddie Mac’s Primary Mortgage Market Survey (PMMS) published on February 26, 2026, the final weekly reading before the early-March rate move.
Post-Move Rate: 6.13%
The post-move rate of 6.13% is based on Mortgage News Daily’s daily mortgage rate index for March 3, 2026. Mortgage News Daily first recorded rates above 6.12% on March 2, the first trading day after the first trading day after rates moved higher in early March.
Note: This analysis measures the cost difference between a pre-move weekly benchmark (Freddie Mac PMMS, 5.98%) and an early post-move daily benchmark (Mortgage News Daily, 6.13%). Because Freddie Mac publishes weekly averages, we used Mortgage News Daily to capture the immediate post-move level rather than a blended weekly average.
Rate Change Definition
The analysis measures the impact of the observed rate move from 5.98% to 6.13% during early March 2026.
Throughout the analysis, this change is described in timing terms (e.g., “early-March rate move”) rather than attributing it to any single factor. The analysis measures how borrowing costs changed during this period and does not assign causality to a specific event.
Assumptions
- Down payment: 20% of the typical home value
- Loan term: 30-year fixed-rate mortgage (360 payments)
- Loan amount: 80% of the home value
- Borrower profile: a buyer purchasing at the typical home value
The 20% down payment assumption aligns with the borrower profile used in Freddie Mac’s PMMS benchmark and excludes private mortgage insurance (PMI), ensuring comparability across markets.
Excluded Costs
The analysis includes principal and interest payments only.
The following costs are excluded:
- loan points
- origination fees
- closing costs
- property taxes
- homeowners insurance
- private mortgage insurance (PMI)
Calculation
Monthly mortgage payments are calculated using the standard amortization formula:
Where:
- P = loan amount
- r = monthly interest rate (annual rate ÷ 12)
- n = number of payments (360)
Monthly payment changes are calculated as the difference between payments at 6.13% and 5.98%, rounded to the nearest dollar for presentation.
Rounding and Presentation
All monetary values are presented in U.S. dollars and rounded for clarity in the analysis:
- Monthly payment values are rounded to the nearest whole dollar
- Monthly payment differences are rounded to the nearest whole dollar
- Lifetime interest differences are calculated using full amortization schedules and rounded to the nearest whole dollar for presentation
- Intermediate calculations use full precision and are not rounded during computation
As a result, lifetime cost differences may not equal a simple multiple of the rounded monthly payment change.
Verification Example
At the national typical home value of $359,078:
Loan amount (80%): $287,262
Monthly payment at 5.98%: $1,719
Monthly payment at 6.13%: $1,746
Monthly increase: $28
Estimated additional lifetime interest: approximately $9,999
Scope and Limitations
This analysis covers all 50 U.S. states and Washington, D.C., using point-in-time home values (January 2026) and standardized loan assumptions.
Rate movements occurred during a period of heightened market volatility and are not attributed to any single factor, including geopolitical developments, inflation expectations, or broader financial market conditions.
Actual borrower costs may vary based on:
- credit profile
- loan type
- jumbo loan thresholds
- property type
- lender-specific pricing adjustments
This analysis is intended to illustrate the directional impact of the rate move at the typical home value in each state, rather than predict exact costs for individual borrowers.
Notes
- This analysis estimates how the early-March 2026 mortgage rate movement affected borrowing costs across U.S. housing markets. It measures payment sensitivity to rate changes and does not attribute the movement to a single cause.
- Full underlying data tables are included with the report, and calculations and source files are available upon request at contact@ziffy.ai
About Ziffy
Ziffy.ai is the first AI-native, fully integrated all-in-one real estate investing platform that helps investors in the US discover, analyze, finance, and buy properties in one place. It combines intelligent property search, real-time ROI insights, and investor-focused mortgage programs to make investing simpler and smarter.