





Editorial Integrity
Making sound real estate investment decisions begins with reliable, data-driven insights. At Ziffy.ai, we offer an AI-native real estate investing, proprietary data-driven trend analysis, investment mortgage programs like DSCR loans, and a network of over 500 investor-friendly real estate agents to deliver the expertise needed for informed decisions. Our content is crafted by experienced real estate professionals and backed by real-time market data, ensuring you receive accurate and actionable information. Through a rigorous editorial process, we strive to empower your investment journey with trustworthy and up-to-date guidance.
In the median metro among the 382 analyzed, Zillow-modeled property taxes and homeowners insurance are equivalent to about 2.5 months of annual single-family asking rent. In more than a quarter of the markets analyzed, that burden reaches at least three months.
That gap matters because rent alone does not show the full cost of owning a rental property. This analysis compares July 2026 single-family rents with modeled taxes and insurance across 382 metros, before financing, vacancy, repairs, management and other operating costs are added.
Table of Contents
More than 1 in 4 metros have taxes and insurance equal to at least three months of annual rent.
In 107 of the 382 markets analyzed, recurring taxes and insurance take up at least a quarter of gross single-family asking rent before other ownership costs are added.
18 of the 49 analyzed metros ranked among Zillow’s 50 largest cross the three-month mark.
The burden is not confined to smaller markets. Among covered metros ranked in Zillow’s top 50, 18 reach at least 25%, including seven at 30% or more.
New York’s burden is nearly twice Los Angeles’.
Modeled taxes and insurance equal 32.8% of single-family rent in New York versus 18.1% in Los Angeles, showing how sharply the cost burden can differ between major metros.
How We Compare Taxes and Insurance With Rent
The study compares Zillow-modeled property taxes and homeowners insurance with gross annual single-family asking rent across 382 U.S. metros. A 25% T&I share, for example, means taxes and insurance are equivalent to three months of annual asking rent. A 30% share equals 3.6 months.
The insurance component is Zillow’s standardized homeowners-insurance estimate, not a landlord or dwelling-fire insurance quote, so the measure is intended for metro-level comparison rather than property-level underwriting.
The months figure is simply a way to make the burden easier to compare across markets. It does not mean landlords literally lose those months of rent or that the remainder represents cash flow. Mortgage payments, vacancy, repairs, management, HOA dues and other operating costs are not included.
Financing can change the equation further. Our separate analysis of the mortgage rate needed to afford a home found wide differences in the rate required to bring housing costs within a standardized affordability threshold across U.S. metros.
A Simple Three-Band View of the Taxes & Insurance Burden
For a simplified overview, the five detailed reporting bands used later in the analysis are grouped into three broader categories. The 382 metros fall into these groups based on how much of annual single-family asking rent is equivalent to modeled taxes and insurance.
T&I Share of Rent | Metros | Equivalent Rent |
|---|---|---|
Under 20% | 164 | Less than 2.4 months |
20% to under 25% | 111 | 2.4 to under 3 months |
25% and above | 107 | 3 months or more |
The pattern: The burden varies sharply by location. More than one in four metros are at the three-month mark or higher, while 164 remain below 2.4 months.
25% and above: In 107 metros, taxes and insurance equal at least one-quarter of gross annual asking rent, the equivalent of three months or more before financing and other operating costs are considered.
20% to under 25%: Another 111 metros fall in the middle, where taxes and insurance equal roughly 2.4 to three months of annual rent.
Under 20%: In 164 metros, taxes and insurance equal less than one-fifth of annual asking rent, showing how much lighter the recurring-cost burden can be in other markets.
How Taxes & Insurance Burden Varies Across 382 U.S. Metros
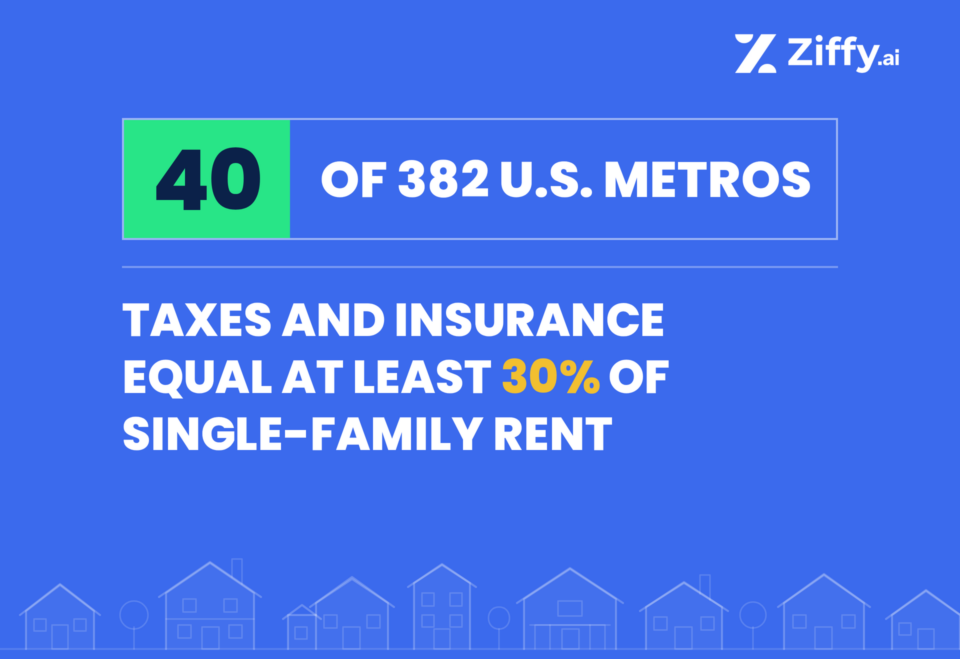
1. In 40 of 382 U.S. metros, taxes and insurance equal at least 30% of single-family asking rent
These 40 metros account for 10.5% of the markets analyzed. At the 30% threshold, annual taxes and insurance are equivalent to at least 3.6 months of gross single-family asking rent. Nine metros reach at least 33⅓%, or four months of rent, although the two markets above 40% carry RATE_HIGH review flags, are flagged for additional local validation, and should be interpreted cautiously.
2. 107 Metros Reach at Least Three Months of Annual Asking Rent
107 of 382 metros, or 28.0%, reach a T&I share of at least 25%. The finding extends across 22 states, showing that the three-month threshold is considerably broader than the smaller group of metros at 30% or above.
3. The median metro has taxes and insurance equal to about 2.5 months of annual rent
The median T&I share across the 382 metros is 20.98%, equivalent to 2.52 months of annual single-family asking rent. Overall, 218 metros are at or above 20%, while 164 remain below it. This is a median across metros, not a population-weighted national estimate.
4. 18 of 49 Covered Metros Ranked Among Zillow’s 50 Largest Reach the Three-Month Mark
Among the 49 covered metros with a Zillow SizeRank of 50 or better, 18 have taxes and insurance equal to at least 25% of rent, and seven reach 30% or more. Those seven are Austin, New York, New Orleans, Miami, Hartford, Milwaukee and Oklahoma City, showing that the highest burden tier is not confined to smaller markets.

Amresh Singh
Founder and CEO | Ziffy.ai
Market averages can hide a lot when rent and home values are looked at separately. Bringing rent, value, taxes and insurance into one consistent comparison shows how different the recurring cost burden can be across major metros, while still keeping that analysis separate from property-level underwriting.
5. Austin Has the Highest T&I Share Among Covered Top-50 Zillow Metros
In Austin, taxes and insurance equal 34.0% of single-family asking rent, or about 4.1 months annually. The burden falls to 28.7% in Dallas, 27.1% in San Antonio and 23.7% in Houston, creating a wide spread among Texas’ largest rental markets without leaving the state.
6. Half of the metros above 30% are in the Midwest, while the West has none
The Midwest accounts for 20 of the 40 metros at or above 30%, followed by 12 in the South and eight in the Northeast. The regional divide is also visible at 25%: 46 Midwestern metros reach that level, compared with 37 in the South, 22 in the Northeast and only two in the West. The data show where the burden is concentrated, not what causes the regional differences.
7. Sixteen of Florida’s 22 covered metros have taxes and insurance equal to at least three months of rent
Florida has one of the broadest concentrations in the study: 16 of 22 covered metros reach at least 25%, and five reach 30%. Among its largest markets, Miami is at 30.8%, compared with 25.9% in Tampa and 25.1% in Orlando.
8. Only one of California’s 26 covered metros reaches the three-month threshold
San Francisco, at 26.1%, is the only covered California metro at or above 25%, and none reaches 30%. San Jose sits just below the threshold at 24.6%, while San Diego is at 19.2% and Los Angeles at 18.1%. The result reflects taxes and insurance relative to rent, not the overall cost of housing in California.
A lower tax-and-insurance share does not necessarily mean housing itself is inexpensive. Our earlier analysis of starter home availability across U.S. markets found that sub-$300,000 listings are exceptionally scarce in many California metros.

Debjit Saha
Co-Founder and CTO | Ziffy.ai
The useful question isn’t whether taxes and insurance look high or low on their own. It’s how those recurring costs compare with the rent a market supports. That relationship can make two rental markets look very different before financing and other operating costs are even considered.
9. Every covered metro in Kansas, Oklahoma, Nebraska and South Dakota reaches the three-month mark
All four Kansas metros, four Oklahoma metros, two Nebraska metros and two South Dakota metros in the study have taxes and insurance equal to at least 25% of annual asking rent. Kansas stands out further: Manhattan, Lawrence and Wichita all exceed 30%, while Topeka is at 29.2%.
10. 164 Metros, or 42.9%, Remain Below a 20% Taxes & Insurance Share
The high-burden markets are only one side of the distribution. 164 of 382 metros, or 42.9%, have taxes and insurance equal to less than one-fifth of annual asking rent. Among recognizable larger markets, Phoenix is at 12.5%, Nashville at 16.3%, Charlotte at 16.6% and Los Angeles at 18.1%.
Full Distribution of Taxes & Insurance Burden Across 382 Metros
The burden is spread widely across the 382 metros analyzed rather than clustering around a single threshold. The table below shows how markets are distributed across five T&I-to-rent bands, from metros where taxes and insurance equal less than 20% of annual asking rent to those where the share reaches one-third or more.
T&I share of rent | Equivalent months of rent | Number of metros | Share of analyzed metros |
|---|---|---|---|
Under 20% | Under 2.4 | 164 | 42.9% |
20% to under 25% | 2.4 to under 3.0 | 111 | 29.1% |
25% to under 30% | 3.0 to under 3.6 | 67 | 17.5% |
30% to under 33⅓% | 3.6 to under 4.0 | 31 | 8.1% |
33⅓% and above | 4.0 or more | 9 | 2.4% |
Austin Has the Highest Burden Among Covered Metros Ranked in Zillow’s Top 50
Austin leads the 49 covered metros ranked among Zillow’s 50 largest, with taxes and insurance equal to 34.0% of single-family asking rent, or just over four months of annual rent. New York follows at 32.8%, while five other large metros also cross the 30% mark.
Metro | Zillow SizeRank | SFR | SFR | Modeled | T&I share | Months |
|---|---|---|---|---|---|---|
Austin, TX | 29 | $2,321 | $431K | $9,477 | 34.0% | 4.08 |
New York, NY | 1 | $3,580 | $762K | $14,079 | 32.8% | 3.93 |
New Orleans, LA† | 47 | $1,925 | $266K | $7,395 | 32.0% | 3.84 |
Miami, FL | 8 | $3,441 | $570K | $12,723 | 30.8% | 3.70 |
Hartford, CT | 49 | $2,658 | $429K | $9,774 | 30.6% | 3.68 |
Milwaukee, WI | 41 | $1,905 | $409K | $6,945 | 30.4% | 3.65 |
Oklahoma City, OK | 42 | $1,579 | $248K | $5,735 | 30.3% | 3.63 |
Kansas City, MO | 31 | $1,839 | $333K | $6,369 | 28.9% | 3.46 |
Dallas, TX | 4 | $2,385 | $368K | $8,210 | 28.7% | 3.44 |
Cleveland, OH | 35 | $1,763 | $262K | $5,800 | 27.4% | 3.29 |
Note: New Orleans passes the current tax-and-insurance rate screen but was flagged in the workbook’s separate historical consistency check. Its current result remains in the table for transparency, but the market warrants additional local validation before being used as a standalone market-level comparison.
Among the 10 Largest Metros, New York’s T&I Share Is 1.8× Los Angeles
The largest housing markets show how differently the same cost stack can interact with local rents. New York’s taxes and insurance equal 32.8% of single-family asking rent, compared with 18.1% in Los Angeles; Dallas is at 28.7%, while Houston is at 23.7%.
Metro | SFR | SFR | Combined | T&I share | Months | Census |
|---|---|---|---|---|---|---|
New York, NY | $3,580 | $762K | 1.85% | 32.8% | 3.93 | North |
Los Angeles, CA | $4,483 | $1.03M | 0.95% | 18.1% | 2.17 | West |
Chicago, IL | $2,576 | $380K | 1.41% | 17.4% | 2.09 | Midwest |
Dallas, TX | $2,385 | $368K | 2.23% | 28.7% | 3.44 | South |
Houston, TX | $2,251 | $311K | 2.06% | 23.7% | 2.84 | South |
Washington, DC | $3,358 | $626K | 1.35% | 20.9% | 2.51 | South |
Philadelphia, PA | $2,361 | $402K | 1.91% | 27.1% | 3.26 | North |
Miami, FL | $3,441 | $570K | 2.23% | 30.8% | 3.70 | South |
Atlanta, GA | $2,311 | $389K | 1.57% | 22.0% | 2.65 | South |
Boston, MA | $3,828 | $783K | 1.31% | 22.3% | 2.67 | North |
Note: Chicago is flagged by the historical-consistency screen. Its derived 1.41% combined T&I rate is also below recent effective property-tax estimates for Cook County alone, so the metro result warrants additional local validation and should not be interpreted as evidence that Chicago is necessarily a low-T&I market.
Complete List: 40 Metros at or Above a 30% Taxes & Insurance Share
The highest-burden group includes 40 of the 382 metros analyzed, where taxes and insurance equal at least 30% of gross single-family asking rent. That translates to 3.6 months of annual rent or more before mortgage financing and other operating costs are considered.
The list spans large markets such as Austin, New York, Miami and Milwaukee as well as smaller metros across the Midwest, South and Northeast. Six observations have unusually high implied tax-and-insurance rates under the standardized model and are marked for additional local review rather than removed from the ranking.
Note: Rockford, Albany, Peoria, Danville, Carbondale and Decatur have combined modeled T&I rates of 3.0% or higher and are marked for additional local validation. They remain in the ranking for transparency but warrant additional local validation before being used as standalone market-level comparisons.
Note: New Orleans and Ocala separately appear in the workbook’s historical-consistency screen. Their current values remain in the table for transparency, but both markets warrant additional local validation before being used as standalone market-level comparisons.
As a conservative check, excluding every metro flagged by either the current-rate or historical-consistency data-quality review leaves 32 metros at or above the 30% threshold. The median T&I share across the remaining metros remains essentially unchanged at about 21%, indicating that the broader pattern is not being driven by the flagged observations.
Lower-Burden Markets After Data Quality Checks
The lower end of the distribution shows just how wide the metro gap can be. Among markets that pass the current low-rate data-quality screen and are not flagged by the separate historical-consistency check, Salisbury is at 10.0%, while Knoxville, Spartanburg, Boise and Auburn are all below 11%.
Metro | T&I share | Months | SFR | SFR | Combined |
|---|---|---|---|---|---|
Salisbury, MD | 10.0% | 1.20 | $2,168 | $425K | 0.61% |
Knoxville, TN | 10.6% | 1.27 | $2,167 | $370K | 0.74% |
Spartanburg, SC | 10.7% | 1.28 | $1,800 | $279K | 0.82% |
Boise City, ID | 10.8% | 1.29 | $2,333 | $499K | 0.60% |
Auburn, AL | 10.8% | 1.30 | $1,902 | $357K | 0.69% |
Morgantown, WV | 11.1% | 1.33 | $1,800 | $229K | 1.04% |
Colorado Springs, CO | 11.1% | 1.33 | $2,383 | $462K | 0.69% |
Columbia, SC | 11.2% | 1.34 | $1,862 | $258K | 0.97% |
Sumter, SC | 11.2% | 1.35 | $1,640 | $202K | 1.10% |
Dover, DE | 11.2% | 1.35 | $2,140 | $376K | 0.77% |
Methodology
Data Sources
This analysis was conducted on August 31, 2026, using the latest common monthly observation available across five Zillow metro-level series: July 2026. The same observation month is used throughout so rents, home values and housing-payment measures are aligned.
1. Single-family asking rents
Zillow’s ZORI, Single-Family (SA) supplied the typical monthly single-family asking rent for each metro. ZORI is a smoothed and seasonally adjusted measure of asking rents rather than rents actually collected under existing leases.
The July 2026 observation is annualized and used as the gross single-family asking-rent measure throughout the analysis.
2. Single-family home values
Zillow’s ZHVI, Single-Family (SA) supplied the typical single-family home value for each metro.
This measure is used to estimate modeled annual taxes and insurance for the typical single-family home so the property type aligns with the Single-Family ZORI rent measure.
3. All-homes home values
Zillow’s ZHVI, All Homes (SA) supplied the home-value base used with Zillow’s housing-payment series.
The all-homes series is required because Zillow’s Mortgage Payment and Total Monthly Payment measures are constructed from its all-homes value series. The analysis derives the combined tax-and-insurance rate within that framework before applying it to Single-Family ZHVI.
4. Mortgage Payment – 20% Down
Zillow’s Mortgage Payment – 20% Down series supplied the estimated monthly principal-and-interest payment for the typical home in each metro.
This measure is used only to remove mortgage principal and interest from Zillow’s Total Monthly Payment. The 20%-down convention is therefore a feature of the Zillow source series, not an assumption about how a rental-property investor finances a purchase.
5. Total Monthly Payment – 20% Down
Zillow’s Total Monthly Payment – 20% Down series supplied the estimated total monthly housing payment for each metro.
Under Zillow’s methodology, this payment includes mortgage principal and interest, modeled property taxes, modeled homeowners insurance and a maintenance component. The analysis removes principal and interest and maintenance to isolate the combined modeled tax-and-insurance amount.
Metros Included in the Analysis
The final analysis includes 382 U.S. metros with valid July 2026 observations across all five required Zillow series and a positive extracted tax-and-insurance amount.
Zillow’s national U.S. observation is excluded.
The five sources are matched using Zillow RegionID rather than metro-name text. No RegionID appears more than once among the 382 metros.
The results therefore describe the common metro coverage available across all five required Zillow measures rather than every metropolitan area in the United States.
How the Rental Cost Burden Was Defined
The analysis compares Zillow-modeled property taxes and homeowners insurance for the typical single-family home with gross annual single-family asking rent.
For each metro:
Annual SFR Asking Rent = Monthly Single-Family ZORI × 12
The primary measure is:
T&I Share of Rent = Annual Modeled SFR T&I ÷ Annual SFR Asking Rent
A higher percentage means modeled taxes and insurance represent a larger share of the typical single-family asking-rent base in that metro.
The measure is designed for consistent metro-to-metro comparison. It is not cash flow, net rental yield, NOI, cap rate or a measure of property-level profitability.
How Modeled Taxes and Insurance Were Extracted
Zillow’s Total Monthly Payment includes a maintenance component equal to 0.5% of home value annually.
For each metro:
Monthly Maintenance = All-Homes ZHVI × 0.5% ÷ 12
The analysis then removes mortgage principal and interest and the maintenance component from Zillow’s Total Monthly Payment:
Monthly Modeled T&I = Total Monthly Payment − Mortgage Payment − Monthly Maintenance
The remaining amount represents Zillow’s combined modeled property taxes and homeowners insurance.
No separate property-tax rate or homeowners-insurance rate is introduced into the calculation.
How the Combined T&I Rate Was Calculated
Because Zillow’s payment series is based on its all-homes value measure, the extracted monthly tax-and-insurance amount is first converted into an implied annual rate:
Combined T&I Rate = Monthly Modeled T&I × 12 ÷ All-Homes ZHVI
This is a combined property-tax-and-homeowners-insurance rate. The analysis does not separate the two components and therefore does not attribute a metro’s result specifically to taxes or insurance.
How the Single-Family T&I Amount Was Calculated
The derived combined rate is then applied to Zillow’s Single-Family ZHVI:
Annual Modeled SFR T&I = Combined T&I Rate × Single-Family ZHVI
This step aligns the property-value measure with the single-family asking-rent measure used in the final comparison.
It assumes that the combined regional T&I rate derived from Zillow’s all-homes payment series is applicable to the typical single-family home in the same metro.
Note: This is a standardized metro-level assumption. It is not an estimate of the actual tax bill or insurance premium for a specific rental property.
How Months of Rent Were Calculated
To make the T&I share easier to interpret, the analysis also expresses it as an equivalent number of months of annual asking rent:
Months of Rent Equivalent = T&I Share of Rent × 12
| T&I share of rent | Equivalent months of annual rent |
|---|---|
| 20% | 2.4 months |
| 25% | 3.0 months |
| 30% | 3.6 months |
| 33⅓% | 4.0 months |
| 40% | 4.8 months |
The months figure is a communication measure. It does not mean a landlord literally pays specific months of rent toward taxes and insurance, nor does it mean the remaining months represent cash flow.
Burden Bands
Metros are grouped into five ranges for comparison:
| T&I share of rent | Equivalent months of rent |
|---|---|
| Under 20% | Under 2.4 months |
| 20% to under 25% | 2.4 to under 3.0 months |
| 25% to under 30% | 3.0 to under 3.6 months |
| 30% to under 33⅓% | 3.6 to under 4.0 months |
| 33⅓% and above | 4.0 months or more |
These categories are reporting bands, not economic thresholds. A metro at 24.9% is not materially different from one at 25.1%.
Exact, unrounded T&I shares are used for rankings and calculations.
Quality Review and Local Validation
The analysis applies additional screening rules to identify unusually high or low implied combined T&I rates that warrant local review:
- High-rate review: combined T&I rate of 3.0% or higher
- Low-rate review: combined T&I rate of 0.6% or lower
These thresholds are analyst-selected quality-control screens rather than statistical definitions of outliers.
Flagged metros remain in the complete rankings for transparency but are not used as primary standalone local claims without additional validation.
A separate historical consistency check compares implied combined T&I rates in July 2021 and July 2026. This check is used for quality review only and is not used to claim that taxes and insurance increased nationally by a particular amount.
Limitations
- Asking rents are not collected rents: ZORI measures asking rents rather than rents actually received under existing leases.
- ZHVI represents a typical market value: It is not a specific property’s purchase price, appraisal or taxable assessed value.
- Property taxes are not investor-specific: Zillow’s modeled tax component is not an individual property-tax bill. Actual taxes on a rental property may differ because of reassessment rules, exemptions, property classifications, owner-occupancy provisions and other local tax rules.
- Homeowners insurance is modeled: Zillow’s insurance component is a standardized homeowners-insurance estimate, not a landlord or dwelling-fire insurance quote.
- Taxes and insurance are combined: The analysis cannot determine which component is responsible for a metro’s higher or lower burden.
- The all-homes rate is applied to single-family values: The analysis assumes the regional combined T&I rate derived from Zillow’s all-homes payment series is applicable to the typical single-family home.
- Financing is excluded from the final burden measure: Mortgage debt service is not included in the T&I share of rent.
- Other operating costs are excluded: Vacancy, property management, repairs, capital expenditures, HOA dues, utilities, leasing expenses and other ownership costs are outside the calculation.
- The analysis does not measure profitability: The results are not cash flow, NOI, cap rate or net rental yield.
- The analysis is not an underwriting model: It does not determine DSCR qualification, mortgage eligibility or borrower-level affordability.
- Metro-level values can conceal local variation: Rents, property taxes, insurance premiums and home values may vary substantially within the same metro.
- Zillow series may be revised: The findings reflect the source observations available when the analysis was conducted on August 31, 2026.
Technical Notes and Replicability
Definitions
| Term | Definition |
|---|---|
| Single-Family ZORI | Zillow’s typical monthly single-family asking-rent measure |
| Single-Family ZHVI | Zillow’s typical single-family home-value measure |
| All-Homes ZHVI | Zillow’s typical value across all homes; used with the payment series |
| Monthly modeled T&I | Total Monthly Payment minus Mortgage Payment and Zillow’s maintenance component |
| Combined T&I rate | Annualized modeled T&I divided by All-Homes ZHVI |
| Annual modeled SFR T&I | Combined T&I rate multiplied by Single-Family ZHVI |
| T&I share of rent | Annual modeled SFR T&I divided by annual SFR asking rent |
| Months of rent equivalent | T&I share multiplied by 12 |
| Annual SFR asking rent | Monthly Single-Family ZORI multiplied by 12 |
| Zillow SizeRank | Zillow’s market-size ranking used for large-metro comparisons |
Geographic Matching
The five Zillow sources are matched using RegionID, Zillow’s geographic identifier.
Only metros with a valid July 2026 observation across all five required series and a positive extracted T&I amount are retained.
Metro display names and state assignments follow Zillow’s source records.
For regional summaries, metros are assigned to the Northeast, Midwest, South or West using Zillow’s primary state designation. Because some CBSAs cross state lines, the regional summaries should be interpreted as standardized metro assignments rather than population-weighted classifications of every county within a metro.
Aggregation and Ranking Approach
National counts are metro counts, not household-weighted, population-weighted, home-value-weighted or rental-stock-weighted estimates.
Each of the 382 metros contributes one observation to statistics such as the number and share reaching 20%, 25% or 30%.
The analysis therefore describes the share of included metros meeting each condition. It does not estimate the share of U.S. households, landlords, rental properties or rental income affected.
Metro burden rankings use each market’s exact, unrounded T&I share of rent.
Large-market comparisons use Zillow SizeRank rather than selecting metros based on burden severity.
Quality-Control Steps
- confirmed that all 382 metros contain the required July 2026 observations;
- confirmed that Zillow’s national U.S. observation is excluded;
- checked for duplicate RegionIDs;
- confirmed that extracted monthly T&I is positive for every included metro;
- independently recalculated monthly maintenance and extracted modeled T&I;
- recalculated the combined T&I rate;
- recalculated annual modeled single-family T&I;
- recalculated annual single-family asking rent;
- recalculated T&I share and months of rent equivalent;
- confirmed the 20%, 25%, 30%, 33⅓% and 40% threshold classifications;
- recalculated burden rankings from unrounded values;
- reviewed unusually high and low combined T&I rates;
- reviewed the historical consistency screen; and
- checked national, regional, state and large-metro claims against the underlying metro records.
Displayed dollar values, percentages and months-of-rent figures are rounded for readability. Calculations, classifications and rankings use unrounded values.
Replicability
To reproduce the central calculation for a metro:
- Obtain the metro’s July 2026 Single-Family ZORI.
- Obtain its July 2026 Single-Family ZHVI.
- Obtain its July 2026 All-Homes ZHVI.
- Obtain Zillow’s July 2026 Mortgage Payment – 20% Down.
- Obtain Zillow’s July 2026 Total Monthly Payment – 20% Down.
- Calculate monthly maintenance: All-Homes ZHVI × 0.005 ÷ 12.
- Subtract monthly mortgage payment and maintenance from Total Monthly Payment to isolate modeled T&I.
- Multiply monthly modeled T&I by 12 and divide by All-Homes ZHVI to calculate the combined T&I rate.
- Multiply the combined T&I rate by Single-Family ZHVI to calculate annual modeled SFR T&I.
- Multiply Single-Family ZORI by 12 to calculate annual SFR asking rent.
- Divide annual modeled SFR T&I by annual SFR asking rent to calculate the T&I share.
- Multiply the resulting share by 12 to calculate the equivalent months of annual asking rent.
Notes
- All metro counts and shares refer to the 382 metros analyzed unless otherwise stated.
- All five primary Zillow measures use the July 2026 observation.
- Percentages, dollar amounts and months-of-rent figures are displayed in rounded form, while calculations and rankings use unrounded values.
- Burden bands are used for communication rather than as natural economic breakpoints.
- Zillow’s 20%-down payment convention is used only to extract modeled taxes and insurance; it is not an investor-financing assumption.
- “Taxes and insurance” refers to Zillow-modeled property taxes and homeowners insurance unless otherwise stated.
- The months-of-rent equivalent is a communication measure and should not be interpreted as literal rent lost, net operating income or remaining cash flow.
- The results are standardized metro-level comparisons and should not replace property-level tax research, insurance quotes or investment underwriting.
- Additional metro-level rankings, state and regional comparisons, and local validation notes are available upon request at contact@ziffy.ai.
About Ziffy
Ziffy is an AI-native real estate investment platform that helps investors discover, analyze, and finance U.S. real estate opportunities. The platform combines property search, investment analysis, and access to specialized financing solutions, including DSCR, fix-and-flip, and bridge loans. This research was produced by Ziffy’s data analytics team to provide transparency into rental housing costs, ownership expenses, and affordability trends across U.S. markets.