Save Search
Filters Applied
EditEdit Filters
Price: $300K - 500K
Monthly Cash Flow: 1 - 3k+
Home Type: Single Family
Loading Maps & Overview...
Loading Calculator...


A quick, investor-focused snapshot highlighting income strength, yield potential.
| Key metrics | Value |
|---|---|
| Price | $399,900 |
| Est. Rent | $3,200/mo |
| ROI | 18% |
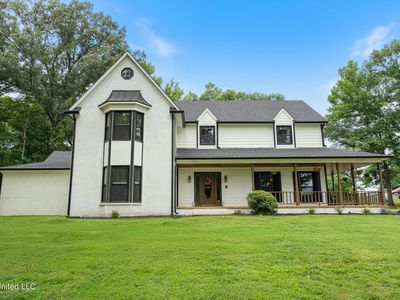
Investment property for sale in Hernando at 5861 Belmont Rd, Hernando, MS, 38632 listed at $640,000 pairs $4,667/mo rent with a $3,132/mo payment to leave $751/mo cash flow. Total monthly income runs $4,667/mo, and annual cash flow reaches $9,012/yr on $210,560 cash to close. Return on cash invested measures 24.34% in year one, and rental yield registers 8.75% at a $640,000 basis. Equity gained on principal adds $4,130/yr, and annual property appreciation at 5% supports $176,820 by year five. Five-year ROI tracks 126.46% and total cumulative return in cash totals $266,274. Financing can be arranged with Ziffy Mortgage’s DSCR loan, which qualifies using $4,667/mo property income relative to a $3,132/mo payment rather than your personal income (W2, Tax Returns, Paystubs, or 1099).
Single Family
Built in 2019
1.98 Acres lot
$N/A/sqft
No HOA
Neighborhood data shown for ZIP Code: 38632, Hernando, MS area.
| Category | Value |
|---|---|
| Total HU (Housing Units) | 12,513 (100%) |
| Owner Occupied HU | 10,035 (80.2%) |
| Renter Occupied HU | 1,589 (12.7%) |
| Vacant Housing Units | 889 ( 7.1%) |
| Median Home Value | $352,383 |
| Average Home Value | $379,373 |
Residential
12,077
Single Family
11,627
Multi-Family
450
Businesses
841
Date | Event | Price |
|---|---|---|
| 2024-10-08 | Price change | $640,000 |
| 2024-10-04 | Price change | $649,000 |
| 2024-09-26 | Listed for sale | $650,000 |
Date | Tax Paid | Tax Increase Rate | Value | Value Increase Rate |
|---|---|---|---|---|
| 2023-10-16 | $3429.60 | 11.44% | $36,934 | 10.43% |
| 2022-10-16 | $3077.48 | N/A | $33,447 | N/A |
| 2021-10-16 | $3077.48 | 8.44% | $33,447 | 7.64% |
Listed by: Lauren Raper • Keller Williams Realty - MS
Mls Name: MLS United
Mls ID: #4092611
Disclaimer: Information is deemed to be reliable but not guaranteed. Copyright 2024 MLS United, LLC.