Save Search
Filters Applied
EditEdit Filters
Price: $300K - 500K
Monthly Cash Flow: 1 - 3k+
Home Type: Single Family
Loading Maps & Overview...
Loading Calculator...


A quick, investor-focused snapshot highlighting income strength, yield potential.
| Key metrics | Value |
|---|---|
| Price | $399,900 |
| Est. Rent | $3,200/mo |
| ROI | 18% |
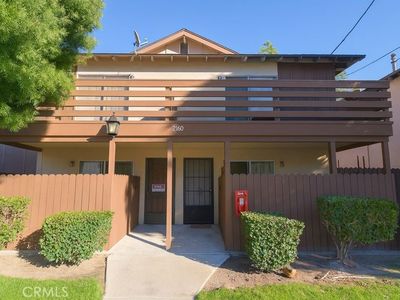
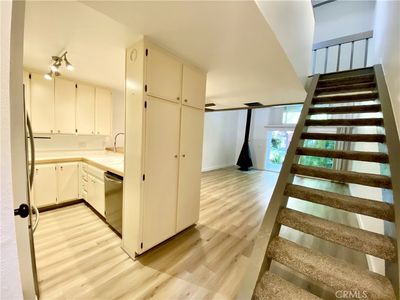
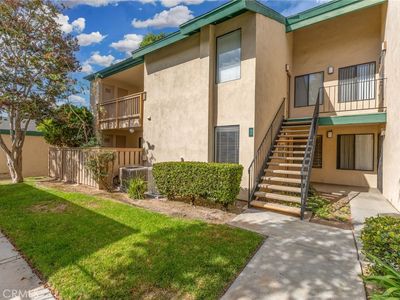
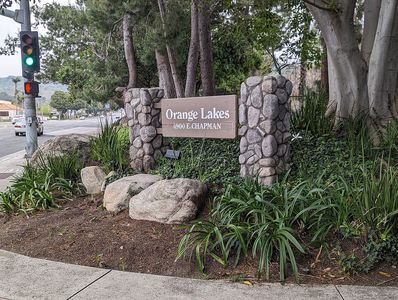
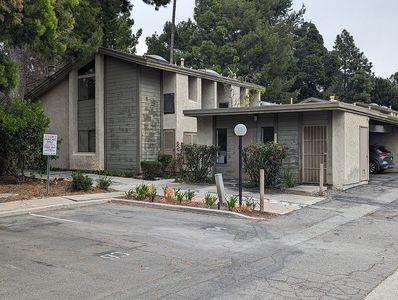
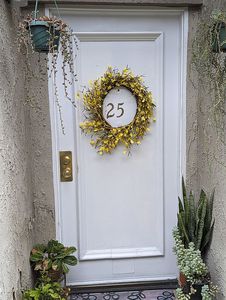
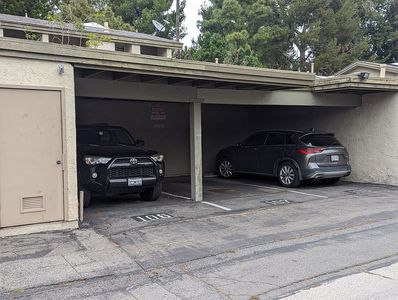
Investment property for sale in Orange at 4900 E Chapman Ave UNIT 25, Orange, CA, 92869 listed at $485,000 pairs $2,800/mo rent with a $2,374/mo payment. Total monthly income runs $2,800/mo. Return on cash invested measures 13.83% in year one, and rental yield registers 6.93% at a $485,000 basis. Equity gained on principal adds $3,130/yr, and annual property appreciation at 5% supports $133,997 by year five. Five-year ROI tracks 71.86% and total cumulative return in cash totals $115,538. Financing can be arranged with Ziffy Mortgage’s DSCR loan, which qualifies using $2,800/mo property income relative to a $2,374/mo payment rather than your personal income (W2, Tax Returns, Paystubs, or 1099).
Condo
Built in 1976
740 sqft lot
$N/A/sqft
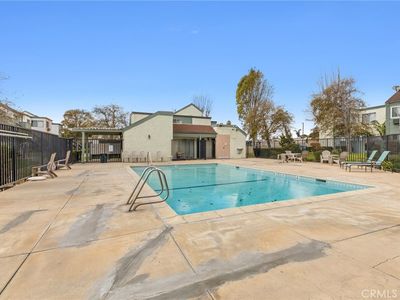
$531 monthly HOA
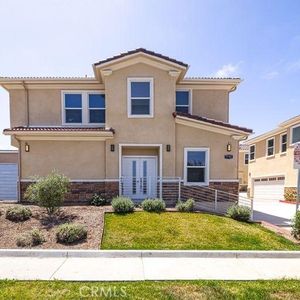
Neighborhood data shown for ZIP Code: 92869, Orange, CA area.
| Category | Value |
|---|---|
| Total HU (Housing Units) | 12,095 (100%) |
| Owner Occupied HU | 8,872 (73.4%) |
| Renter Occupied HU | 2,940 (24.3%) |
| Vacant Housing Units | 283 ( 2.3%) |
| Median Home Value | $1,072,388 |
| Average Home Value | $1,183,430 |
Residential
12,088
Single Family
10,537
Multi-Family
1,551
Businesses
428
Date | Event | Price |
|---|---|---|
| 2025-05-19 | Listed for sale | $485,000 |
| 2024-07-09 | Listing removed | N/A |
| 2024-06-26 | Price change | $545,100 |
Date | Tax Paid | Tax Increase Rate | Value | Value Increase Rate |
|---|---|---|---|---|
| 2024-05-20 | $4640.00 | 2.29% | $401,766 | 2.00% |
| 2023-05-20 | $4536.00 | 15.94% | $393,889 | 17.38% |
| 2022-05-20 | $3912.46 | 2.80% | $335,580 | 2.00% |
Listed by: N/A • N/A
Mls Name: undefined
Mls ID: #N/A