Save Search
Filters Applied
EditEdit Filters
Price: $300K - 500K
Monthly Cash Flow: 1 - 3k+
Home Type: Single Family
Loading Maps & Overview...
Loading Calculator...


A quick, investor-focused snapshot highlighting income strength, yield potential.
| Key metrics | Value |
|---|---|
| Price | $399,900 |
| Est. Rent | $3,200/mo |
| ROI | 18% |
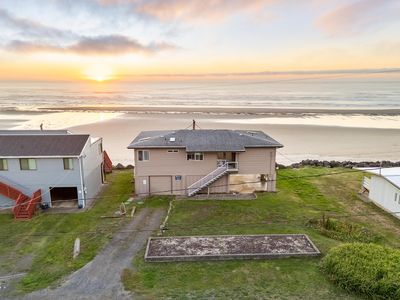
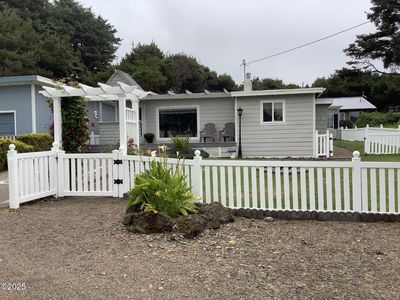
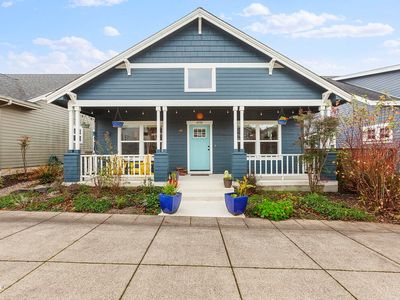
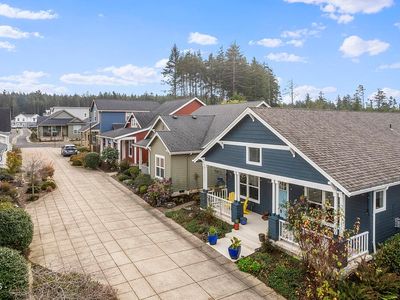
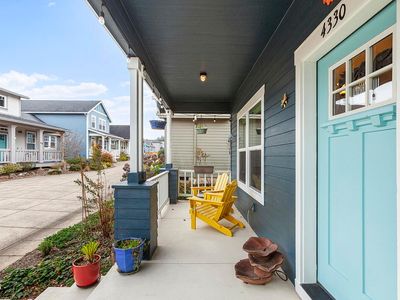
Investment property for sale in South Beach at 4330 SE Fleming St, South Beach, OR, 97366 earns $209/mo cash flow from $3,227/mo rent with a $2,447/mo payment. Total monthly income totals $3,227/mo, and annual cash flow totals $2,510/yr on $165,750 capital. ROI tracks 21.42% on current figures, and rental yield reads 7.74% at a $500,000 purchase. Equity gained on principal adds $3,226/yr, and 5% annual appreciation supports $138,141 over five years. Five-year ROI reaches 110.78% and total cumulative return in cash sums $183,620. Financing can be set up with Ziffy Mortgage’s DSCR loan, which is driven by $3,227/mo property income instead of your personal income.
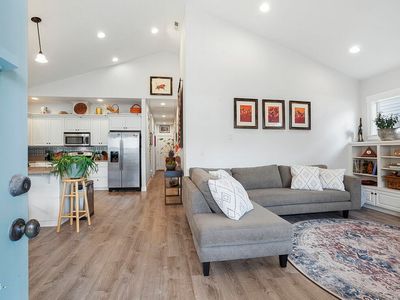
Single Family
Built in 2013
3,920 sqft lot
$N/A/sqft
No HOA
Neighborhood data shown for ZIP Code: 97366, South Beach, OR area.
| Category | Value |
|---|---|
| Total HU (Housing Units) | 1,153 (100%) |
| Owner Occupied HU | 651 (56.5%) |
| Renter Occupied HU | 222 (19.3%) |
| Vacant Housing Units | 280 (24.3%) |
| Median Home Value | $556,564 |
| Average Home Value | $601,644 |
Residential
893
Single Family
868
Multi-Family
25
Businesses
59
Date | Event | Price |
|---|---|---|
| No price history data available | ||
Date | Tax Paid | Tax Increase Rate | Value | Value Increase Rate |
|---|---|---|---|---|
| No tax history data available | ||||
Listed by: Victoria M Strauss • Martek Real Estate
Mls Name: OCMLS
Mls ID: #25-2511