


Editorial Integrity
Making sound real estate investment decisions begins with reliable, data-driven insights. At Ziffy.ai, we offer an AI-native real estate investing, proprietary data-driven trend analysis, investment mortgage programs like DSCR loans, and a network of over 500 investor-friendly real estate agents to deliver the expertise needed for informed decisions. Our content is crafted by experienced real estate professionals and backed by real-time market data, ensuring you receive accurate and actionable information. Through a rigorous editorial process, we strive to empower your investment journey with trustworthy and up-to-date guidance.
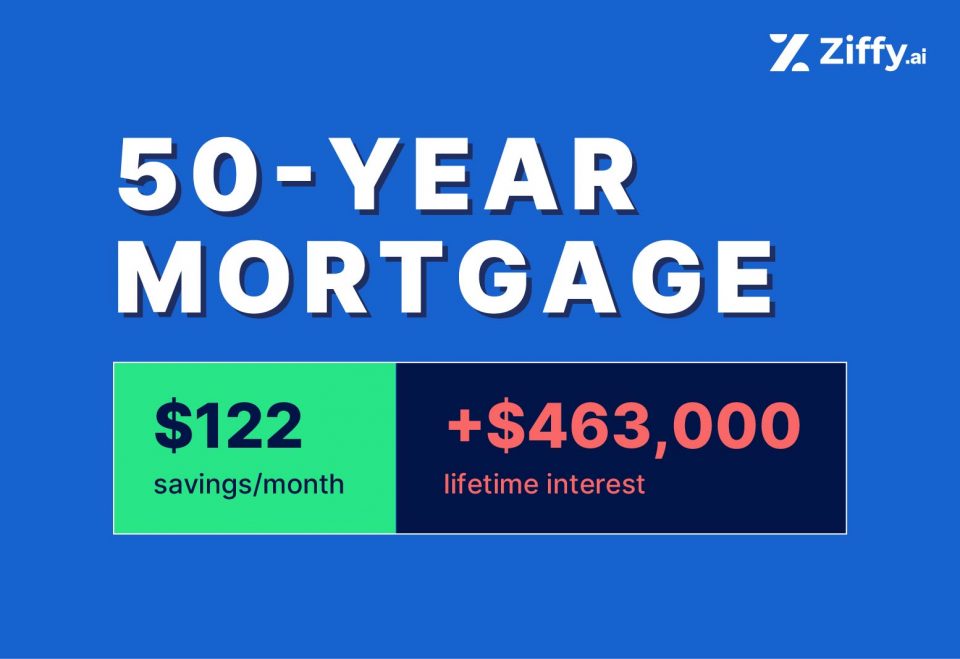
Policymakers are floating a 50-year mortgage as an affordability fix, but our analysis of the 100 largest metros finds the opposite. On the median home price of $406,000, the monthly payment falls about $122 (roughly 5.4%), while lifetime interest rises about $463,000, or 114% of the dataset’s median home price. In practical terms, every $1 saved monthly adds about $3,800 in interest, and after 10 years a 50-year borrower has repaid 3.5% of the loan versus 15.8% on a 30-year. The trade-off is small monthly relief at the cost of much higher lifetime expense and slower equity building.
Table of Contents
Key Highlights
-
 A 50-year mortgage adds $463,000 in extra lifetime interest on the median home, about 2.05× the 30-year interest and roughly 114% of $406,000 (top 100 metro median home price). 29 of 100 metros top $500,000 in extra interest.
 - The monthly payment falls only $122 (–5.4%) and the required income for qualification drops just $5,200 (–4.3%). Even so, 92 of 100 metros remain unaffordable at the median household income and only 4 of 100 metros flip from “no” to “yes.”
- After 10 years, 50-year borrowers have repaid 3.5% of the loan versus 15.8% on a 30-year; an average $45,000 “ghost equity” shortfall. Matching the 30-year’s 10-year equity takes ~25 years on a 50-year.
50-yr Mortgage Payment Trap: Lower payments, lifetime debt
1. Monthly payment falls about $122, or 5.4%, from roughly $2,234 on a 30-year to roughly $2,112 on a 50-year.
This reduction equals about $1,460 per year in relief on the median home across the 100 metros. The term extension is from 360 to 600 payments, which means principal is spread thinly across far more months. Because early mortgage payments are interest-heavy, stretching the schedule barely reduces the monthly bill even as it adds two decades of interest accrual. The structure creates a small monthly discount while setting up very large lifetime costs.
2. For every $1 of monthly payment reduction, borrowers take on about $3,800 of additional lifetime interest.
The ratio comes directly from the averages: $463,000 in extra lifetime interest divided by $122 in monthly savings is approximately 3,800-to-1. Over the full 50-year horizon, the “savings” add up to only $73,000 ($122 × 600), which is far less than the extra interest owed.
3. Lifetime interest rises about $463,000 on the median home, which is roughly 2.05 times the 30-year interest and about 114% of this dataset’s $406,000 median home price.
This is the national center of gravity in your model: a consistent 5.4% monthly payment reduction paired with a 2.05× interest multiple. Using 100 metros’ median listing price ($406,000), the $463,000 lifetime add-on is 114% of that figure. It is about 1.14× the dataset median.
4. 29 metros show more than $500,000 in extra lifetime interest and at least ten metros exceed $700,000, with the largest impacts in high-price markets.
The heaviest dollar totals include San Jose-Sunnyvale-Santa Clara, CA ($1,406,000), Los Angeles-Long Beach-Anaheim, CA ($1,119,000), Oxnard-Thousand Oaks-Ventura, CA ($1,017,000), San Francisco-Oakland-Fremont, CA ($972,000), San Diego-Chula Vista-Carlsbad, CA ($944,000), Boston-Cambridge-Newton, MA-NH ($814,000), Bridgeport-Stamford-Danbury, CT ($814,000), New York-Newark-Jersey City, NY-NJ ($776,000), Seattle-Tacoma-Bellevue, WA ($776,000), and Urban Honolulu ($671,000). These numbers reflect the same amortization math applied to higher price bases, which magnifies the lifetime penalty.
5. San Jose-Sunnyvale-Santa Clara, CA tops with lifetime interest rises by about $1.406 million on a 50-year vs 30-year mortgage, while the monthly payment falls only about $369.
On San Jose’s median listing price near $1.382 million, the payment shifts from roughly $6,783 (30-yr) to $6,414 (50-yr), a modest decrease overwhelmed by +$1.406M in lifetime interest. Los Angeles-Long Beach-Anaheim, CA shows the same pattern (about $5,396 to $5,102 monthly; +$1.119M interest). Oxnard-Thousand Oaks-Ventura, CA adds about $1.017M in extra lifetime interest; the payment reduction is similarly modest relative to the scale of added cost. Across these large California markets, duration (not a meaningful monthly cut) is the cost engine.
Top 10 Metros by Extra Lifetime Interest (50-yr vs 30-yr Mortgage)
Rank | Metro | 30-yr Monthly P&I | 50-yr Monthly P&I | Monthly Savings | Extra Lifetime Interest |
|---|---|---|---|---|---|
1. | San Jose-Sunnyvale-Santa Clara, CA | $6,783 | $6,414 | $369 | $1,406,000 |
2. | Los Angeles-Long Beach-Anaheim, CA | $5,396 | $5,102 | $294 | $1,119,000 |
3. | Oxnard-Thousand Oaks-Ventura, CA | $4,907 | $4,640 | $267 | $1,017,000 |
4. | San Francisco-Oakland-Fremont, CA | $4,687 | $4,432 | $255 | $972,000 |
5. | San Diego-Chula Vista-Carlsbad, CA | $4,552 | $4,304 | $248 | $944,000 |
6. | Boston-Cambridge-Newton, MA-NH | $3,928 | $3,714 | $214 | $814,000 |
7. | Bridgeport-Stamford-Danbury, CT | $3,925 | $3,712 | $214 | $814,000 |
8. | New York-Newark-Jersey City, NY-NJ | $3,744 | $3,540 | $204 | $776,000 |
9. | Seattle-Tacoma-Bellevue, WA | $3,743 | $3,539 | $204 | $776,000 |
10. | Urban Honolulu, HI | $3,236 | $3,060 | $176 | $671,000 |
6. Boston-Cambridge-Newton, MA-NH underscores the pattern outside California: lifetime interest rises about $814,000 while the monthly payment drops only about $214 (from $3,928 to $3,714).
A low-200s monthly reduction paired with an eight-hundred-thousand-dollar lifetime cost increase illustrates how minimal monthly relief scales into a very large interest penalty in high-price East Coast markets.
7. New York–Newark–Jersey City adds about $776,000 in extra lifetime interest.
Despite the small monthly relief, the lifetime interest penalty approaches three-quarters of a million dollars, confirming that payment smoothing, not affordability, is what the 50-year structure delivers in large Northeast metros.
8. Tiny monthly drops still create six-figure costs: Toledo saves $58/mo yet adds $222,000 interest; Akron saves $64/mo yet adds $244,000; Pittsburgh saves $67/mo yet adds $255,000.
These smaller markets show that the duration of debt, not the dollar size of the payment cut, drives outcomes. In Toledo, the 50-year term trims the payment by about $58 per month ($696/year) but adds roughly $222,000 in lifetime interest; in Akron, a $64 monthly reduction ($768/year) coincides with about $244,000 more interest; in Pittsburgh, a $67 monthly reduction ($804/year) pairs with about $255,000 extra interest.
Even when payments fall by less than $70 a month, stretching from 360 to 600 payments adds two extra decades of interest accrual, which overwhelms the modest annual relief and leaves borrowers with a large, unavoidable lifetime penalty.
9. The lifetime “break-even” is unattainable in practice because the cumulative 50-year payment savings are far smaller than the extra interest and because time works against the borrower.
Summing the monthly reduction for 600 months yields only $73,000, which is far below the $463,000 in extra interest. A simple arithmetic comparison implies more than 300 years of $122 savings to offset the extra interest. This back-of-the-envelope view also ignores time value of money, refinancing costs, income volatility, and maintenance shocks, all of which tilt outcomes further away from the borrower.

Amresh Singh
Founder and CEOZiffy
The Qualifying Income Problem: Affordability barely improves
1. National: required income falls only about $5,200 (4.3%) with a 50-year term, which is too small to change outcomes in most metros.
The typical buyer’s annual required income declines from roughly $119,000 on a 30-year to roughly $114,000 on a 50-year. Because lenders qualify on PITI at about a 28% DTI, and taxes and insurance do not shrink when you extend the term, the monthly payment cut of about $122 (5.4%) translates into only a 4.3% drop in the annual income hurdle. The reduction is real but modest, and it does not bridge the typical metro’s income-to-price gap. Our analysis of DTI-based denials shows that a 50-year mortgage changes almost nothing: only about 1% of the 87,000 DTI-based denied loans would meet DTI requirements with a 50-year term.
2. The average 50-year required income is about $114,000 versus a typical median household income near $78,000, leaving a shortfall around $36,000.
This shortfall explains why 92 of 100 metros remain unaffordable at the median even after switching to a 50-year term. The gap is visible across price tiers: Los Angeles-Long Beach-Anaheim, CA still needs $252,000 vs $92,000 median (gap $160,000), San Jose-Sunnyvale-Santa Clara, CA needs $315,000 vs $153,000 (gap $162,000), Miami-Fort Lauderdale-West Palm Beach, FL needs $136,000 vs $76,000 (gap $60,000), Phoenix-Mesa-Chandler, AZ needs $114,000 vs $86,000 (gap $28,000), and even Chicago-Naperville-Elgin, IL-IN needs $104,000 vs $87,000 (gap $17,000).
The pattern is consistent: a 5.4% cut in the monthly payment translates into only 4.3% less annual income needed, which is not enough to move the median household over the qualifying line in most large metros.
3. Each $1 of annual required-income relief corresponds to about $89 in extra lifetime interest.
This ratio comes straight from the workbook math: the median required-income reduction is roughly $5,200 (30-yr to 50-yr), while the average extra lifetime interest is about $463,000. Dividing the lifetime cost by the income “relief” yields $463,000 ÷ $5,200 ≈ $89 of extra interest for every $1 of annual income reduction. In practical terms, the 50-year term relaxes the qualifying bar by only a few thousand dollars per year, but it embeds a six-figure lifetime cost.
Mechanically, this happens because lenders qualify on PITI at 28% DTI: stretching the term nudges the P&I component slightly lower, but taxes and insurance (the T and I) are unchanged, so the income numerator barely moves while the interest clock runs for 240 additional months.
4. San Jose-Sunnyvale-Santa Clara, CA leads the nation in qualification-income reduction, falling from $330,588 to $314,759, a decrease of $15,829 or 4.8%.
San Jose’s mortgage qualifying income declines from about $331,000 to about $315,000 while the median household earns about $153,000 (gap $162,000). Next in line, Los Angeles-Long Beach-Anaheim, CA moves from about $264,000 to about $252,000 against $92,000 median income (gap $160,000).
Oxnard-Thousand Oaks-Ventura, CA ($229,000 50 yr qualifying income vs $107,000 median income), San Francisco-Oakland-Fremont, CA ($219,000 vs $128,000), and San Diego-Chula Vista-Carlsbad, CA ($213,000 vs $104,000) similarly remain far from qualifying. The required income remains roughly twice the median household income, indicating that loan length cannot bridge the fundamental affordability gap in this market.
Top 10 U.S. Metros by Qualifying Income Reduction
Rank | Metro | Median Household Income | 30-yr Required Income | 50-yr Required Income | Income Savings | Can Afford (30yr / 50yr) |
|---|---|---|---|---|---|---|
1. | San Jose-Sunnyvale-Santa Clara, CA | $153,000 | $331,000 | $315,000 | $16,000 | No / No |
2. | Los Angeles-Long Beach-Anaheim, CA | $92,000 | $264,000 | $252,000 | $13,000 | No / No |
3. | Oxnard-Thousand Oaks-Ventura, CA | $107,000 | $241,000 | $229,000 | $11,000 | No / No |
4. | San Francisco-Oakland-Fremont, CA | $128,000 | $230,000 | $219,000 | $11,000 | No / No |
5. | San Diego-Chula Vista-Carlsbad, CA | $104,000 | $224,000 | $213,000 | $11,000 | No / No |
6. | Boston-Cambridge-Newton, MA-NH | $111,000 | $202,000 | $193,000 | $9,000 | No / No |
7. | Bridgeport-Stamford-Danbury, CT | $111,000 | $214,000 | $205,000 | $9,000 | No / No |
8. | New York-Newark-Jersey City, NY-NJ | $95,000 | $189,000 | $181,000 | $9,000 | No / No |
9. | Seattle-Tacoma-Bellevue, WA | $111,000 | $187,000 | $178,000 | $9,000 | No / No |
10. | Urban Honolulu, HI | $103,000 | $153,000 | $146,000 | $8,000 | No / No |
5. Only 4 metros become affordable with 50-year mortgages: Detroit, Baltimore, Buffalo, and St. Louis, all with razor-thin income margins.
Detroit-Warren-Dearborn, MI, Baltimore-Columbia-Towson, MD, Buffalo-Cheektowaga, NY, and St. Louis, MO-IL are the only metros to cross the line. Detroit’s median household income is $72,574 versus a 50-year required income of $71,763, a buffer of just $811. Baltimore shows $94,289 versus $93,677, a $612 buffer. Small changes in taxes, insurance, or rates would erase these gains.
The Ghost Equity Crisis: Paying for a decade, owning almost nothing
1. After 10 years, a 50-year borrower has repaid about 3.5% of the loan versus about 15.8% on a 30-year.
This four-to-one equity gap is a direct result of amortization. The 50-year schedule front-loads interest for much longer, so a decade of payments produces very little principal reduction relative to a standard 30-year term.
2. The average “ghost equity” shortfall after 10 years is about $45,000.
This is money a household would have owned under a 30-year schedule but does not own under a 50-year schedule after the same 120 payments. It represents foregone principal, not price movement, and it materially limits options to refinance, relocate, or borrow against the home.
3. San Jose-Sunnyvale-Santa Clara, CA leads the nation: about $137,000 in 10-year ghost equity; Los Angeles-Long Beach-Anaheim, CA follows at about $109,000; San Francisco-Oakland-Fremont, CA at about $94,000.
Even after 120 payments, 50-year borrowers in high-price markets have only a sliver of principal repaid. The pattern is national: large markets across coasts and the Sun Belt show tens of thousands of dollars in decade-long equity shortfalls.
Top 10 U.S. Metros by Ghost Equity (30 yr – 50 yr Equity)
Rank | Metro | 30-yr Equity (10 yrs) | 50-yr Equity (10 yrs) | Ghost Equity (10 yrs) |
|---|---|---|---|---|
1. | San Jose-Sunnyvale-Santa Clara, CA | $175,000 | $38,000 | $137,000 |
2. | Los Angeles-Long Beach-Anaheim, CA | $139,000 | $30,000 | $109,000 |
3. | Oxnard-Thousand Oaks-Ventura, CA | $127,000 | $28,000 | $99,000 |
4. | San Francisco-Oakland-Fremont, CA | $121,000 | $26,000 | $94,000 |
5. | San Diego-Chula Vista-Carlsbad, CA | $117,000 | $26,000 | $92,000 |
6. | Boston-Cambridge-Newton, MA-NH | $101,000 | $22,000 | $79,000 |
7. | Bridgeport-Stamford-Danbury, CT | $101,000 | $22,000 | $79,000 |
8. | New York-Newark-Jersey City, NY-NJ | $97,000 | $21,000 | $75,000 |
9. | Seattle-Tacoma-Bellevue, WA | $97,000 | $21,000 | $75,000 |
10. | Urban Honolulu, HI | $83,000 | $18,000 | $65,000 |
4. It takes about 19.8 years on a 50-year schedule to reach just 10% of the loan repaid.
A 30-year-old buyer would be about 50 by the time 10% of principal is repaid; a 40-year-old would be about 60. Under the 30-year schedule, the same buyers would be far past this point well before those ages.
5. Matching the 30-year’s 10-year equity requires about 25 years on a 50-year.
A quarter-century of payments on the 50-year schedule is needed to equal what a standard borrower accumulates in the first decade, underscoring the magnitude of the equity delay.
6. Thin equity heightens risk and limits refinancing and home equity loan options.
With <~5% of the loan repaid after a decade on a 50-year schedule, a modest price dip can wipe out a decade of amortization. Low principal repayment also curtails access to cash-out refinancing or HELOCs, reducing flexibility to manage shocks without selling.

Debjit Saha
Co-founder and Real Estate ExpertZiffy
The Break-Even Math: Not plausible at today’s numbers
On the median home, the 50-year term cuts the monthly payment by about $122 (≈ $1,464/year) but adds ~$463,000 in extra lifetime interest. Simple catch-up time = $463,000 ÷ $1,464 ≈ 316–317 years. This is a nominal, back-of-the-envelope comparison (no discounting) and already shows the gap is mathematically unbridgeable through small monthly relief.
Because the structure yields a near-constant trade-off, about $3,800 in extra lifetime interest for every $1 saved monthly, the implied break-even time settles around 3,800 months ÷ 12 ≈ 317 years, whether you’re in San Jose (-$369/mo, +$1.406M interest) or Toledo (-$58/mo, +$222k interest). The scale changes, but the ratio doesn’t.
What monthly cut would be needed to truly break even?
Use: required monthly cut = extra lifetime interest ÷ targeted years ÷ 12. Plugging in $463,000:
Target break-even horizon | Required monthly cut | Gap vs actual –$122 |
|---|---|---|
50 years (the loan term) | $771/month | $650 short |
30 years (standard horizon) | $1,286/month | $1,164 short |
15 years (aggressive) | $2,569/month | $2,447 short |
10 years (decade) | $3,858/month | $3,736 short |
Even to break even within the 50-year term, the monthly payment would need to fall by roughly $771, not $122. To break even on a 30-year horizon, the cut would need to be about $1,286/month.
The table above ignores the time value of money (future savings are worth less today). Discounting the small monthly reductions over long horizons reduces their value, while the added interest persists for 240 extra months. Real-world frictions (refi fees $7k–$18k, payment resets, tax/insurance changes) further widen the gap.
Methodology
Scope & Sources
- Geography (metros): Top 100 U.S. metropolitan areas by population (U.S. Census Bureau).
- Home prices (metros & states): Ziffy.ai, October 2025 snapshot of median listing prices by metro and by state.
- Household income (metros): U.S. Census American Community Survey 2023
- Mortgage rates: Freddie Mac PMMS, November 2025: 30-year fixed 6.22%. The hypothetical 50-year fixed is modeled at 6.72% (+0.50% spread).
- Property tax: Bankrate
- Homeowners insurance: Bankrate state-level averages. For multi-state metros (e.g., New York–Newark–Jersey City, NY–NJ), tax and insurance are taken from the metro’s primary state.
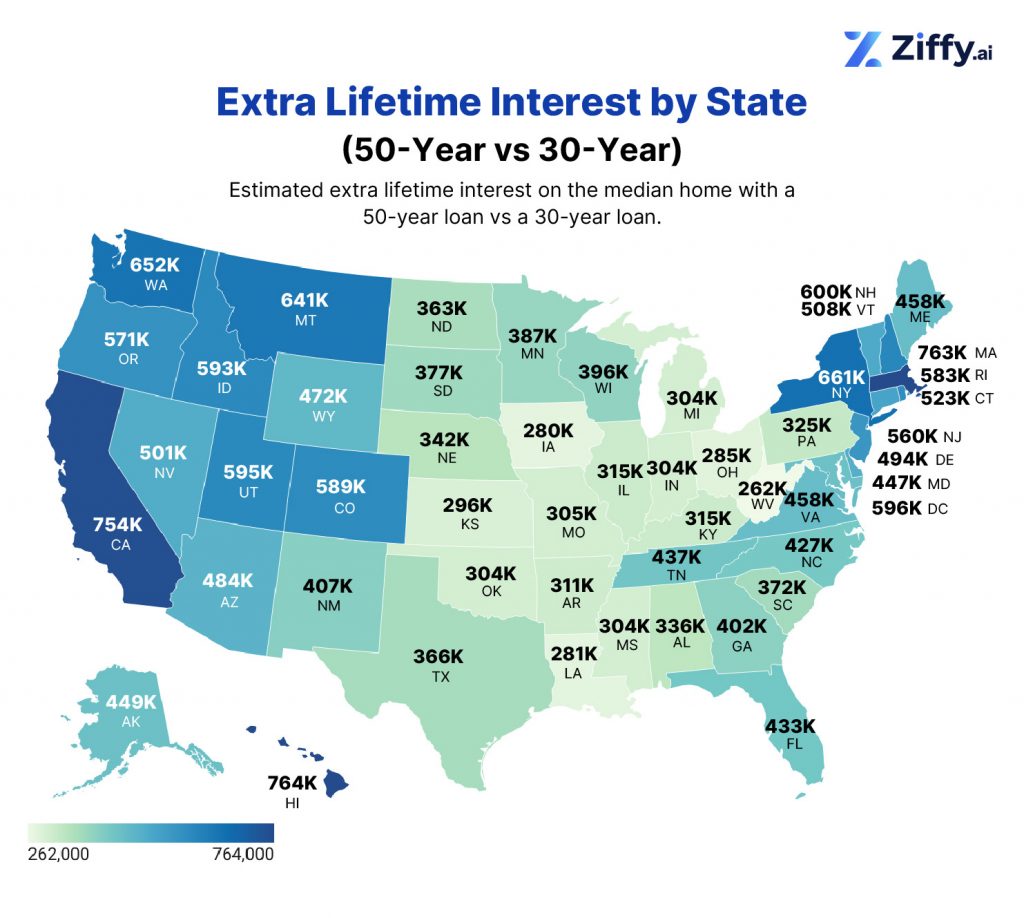
Map graphics note: State maps (monthly savings and 10-year equity build) are derived from state median listing prices (Ziffy.ai, Oct 2025) and state average tax/insurance, not from metro prices.
Core Assumptions
- Down payment: 20% (no PMI).
- Terms: 30 years (360 months) vs 50 years (600 months), fully amortizing, fixed rate.
- Qualification standard: 28% front-end DTI (PITI ÷ income).
- Taxes & insurance: State averages applied uniformly within each metro; held constant in PITI.
- Excluded for comparability: HOA/condo fees, points, closing costs, prepayments.
- No appreciation/inflation: Equity figures reflect principal repaid only (down payment and price changes excluded).
Calculations
1) Monthly Payment (P&I)
- Loan amount = 80% of the median price (metro for the report; state for maps).
- Monthly payment computed with the standard fixed-rate mortgage formula:
- PMT_30 at 6.22%, 360 months.
- PMT_50 at 6.72%, 600 months.
- Monthly difference (payment reduction) = PMT_30 − PMT_50.
- National figures (e.g., ~$122, –5.4%) reflect the dataset’s central tendency across metros.
2) Lifetime Interest & “Extra Interest”
- Total paid = PMT × term months.
- Total interest = total paid − principal.
- Extra lifetime interest = Interest_50 − Interest_30.
- Interest multiple = Interest_50 ÷ Interest_30 (≈2.05× nationally).
- Per-$1 monthly trade-off = (extra lifetime interest) ÷ (monthly payment reduction) (≈$3,800 per $1).
- Arithmetic break-even (nominal) = (extra lifetime interest) ÷ (monthly payment reduction × 12) (≈316–317 years).
3) Required Income (Affordability)
- Monthly property tax = (state tax rate × price) ÷ 12.
- Monthly homeowners insurance = (state average annual premium) ÷ 12.
- PITI (monthly) = P&I + tax + insurance.
- Required gross monthly income = PITI ÷ 0.28; annualized for required income.
- Affordability test: compare required income to metro median HHI (classify and identify “flip” metros from 30-year “no” to 50-year “yes,” reporting the buffer = median HHI − required income on 50-year).
- Policy efficiency ratio: extra lifetime interest ÷ reduction in required annual income (≈$89 of extra interest per $1 of annual relief).
4) Equity After 10 Years & “Ghost Equity”
- Amortization balance after 120 months used to compute principal repaid under each term.
- 10-year equity (principal repaid): ~15.8% of loan amount (30-year) vs ~3.5% (50-year).
- Ghost equity (10-year) = principal repaid on 30-year − principal repaid on 50-year (≈$45,000 nationally).
- Equity stats reflect amortization only (down payment and price changes excluded).
State-Level Maps (Monthly Savings & 10-Year Equity)
- Base: Ziffy.ai state median listing price (Oct 2025); Bankrate state averages for tax and insurance.
- Monthly payment (PMT) formula: PMT = [r * PV] / [1 − (1 + r)^(-N)], where r = annual rate / 12, PV = loan amount, N = number of months.
Extra Lifetime Interest:
- For each term: Total Interest = (PMT × N) − PV.
- Plotted value: Extra Lifetime Interest = Interest(50-year) − Interest(30-year).
- Round to nearest $1,000.
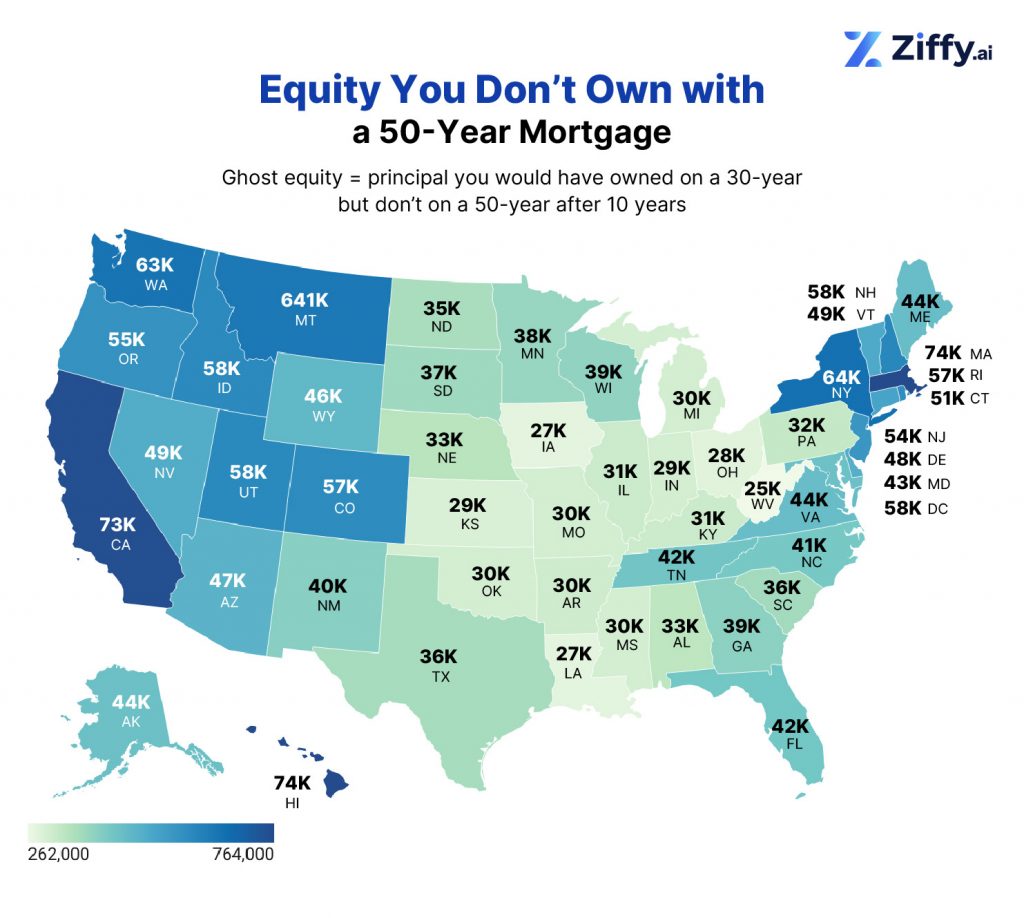
Ghost Equity (10 Years)
- Balance after 120 months:
Balance_120 = PV × (1 + r)^(120) − PMT × [((1 + r)^(120) − 1) / r]. - Equity after 10 years: Equity_10 = PV − Balance_120.
- Plotted value: Ghost Equity (10 yrs) = Equity_10(30-year) − Equity_10(50-year).
- Round to nearest $1,000.
Rounding & Presentation
- Dollars: large totals to nearest $1,000; monthly figures to nearest $1.
- Percents: one decimal place unless precision requires two.