


Editorial Integrity
Making sound real estate investment decisions begins with reliable, data-driven insights. At Ziffy.ai, we offer an AI-native real estate investing, proprietary data-driven trend analysis, investment mortgage programs like DSCR loans, and a network of over 500 investor-friendly real estate agents to deliver the expertise needed for informed decisions. Our content is crafted by experienced real estate professionals and backed by real-time market data, ensuring you receive accurate and actionable information. Through a rigorous editorial process, we strive to empower your investment journey with trustworthy and up-to-date guidance.
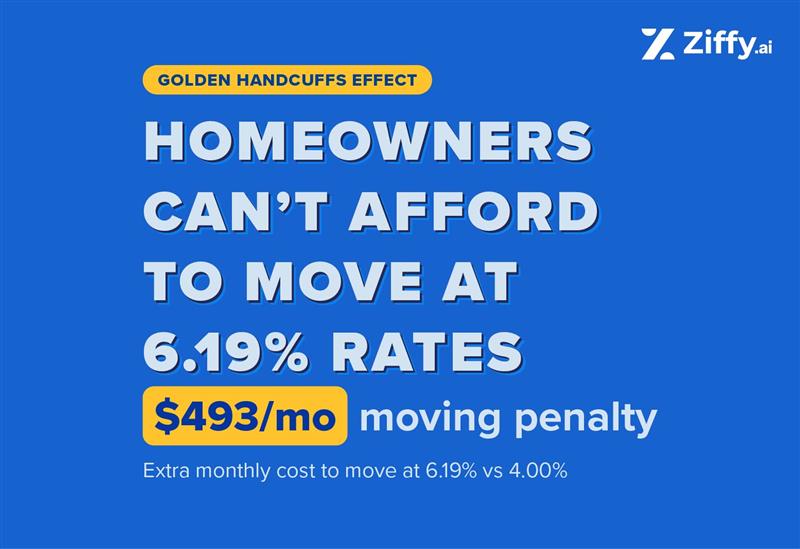
More than half of American mortgage holders are now “locked in” to interest rates below 4%. These rock‑bottom mortgages, once financial blessings, have become the chains of a stagnant housing market. Buying an equivalent-priced home would now cost homeowners an extra $492.97 per month in mortgage payments or roughly $177,471 over 30 years.
Our analysis of 100 major U.S. metros finds that 97 are now unaffordable to their own residents. Across the 100 metros, the average required income is $119,405 while the average local median household income is $81,563, a 46.4% gap. The result is a frozen market where homeowners cannot move and new buyers cannot enter.
Table of Contents
Key Highlights
-
 97 of 100 metros are unaffordable where current residents cannot qualify to purchase homes at today’s prices and rates. The gap between required and actual income averages $37,842, affecting virtually every major employment center in America.
 - Homeowners with 4% mortgages face a $492.97 monthly penalty if they move to a similar home at today’s rates. This difference between their locked-in rate and 6.19% creates an annual cost of $5,916 that makes relocation financially disincentivized.
- Los Angeles-Long Beach-Anaheim, CA posts the worst affordability crisis at a 186% income gap. Residents earning $91,960 would need $263,445 (nearly triple their income) to qualify for the $1,099,000 average home at current rates.
The Moving Penalty: What Locked-In Homeowners Save by Staying Put
1. The average national moving penalty of $492.97 monthly exceeds many households’ car payments.
This $5,916 annual difference between locked-in rates and current rates represents pure interest cost. For a typical family with a low rate, it’s the difference between building wealth and living paycheck to paycheck if they moved.
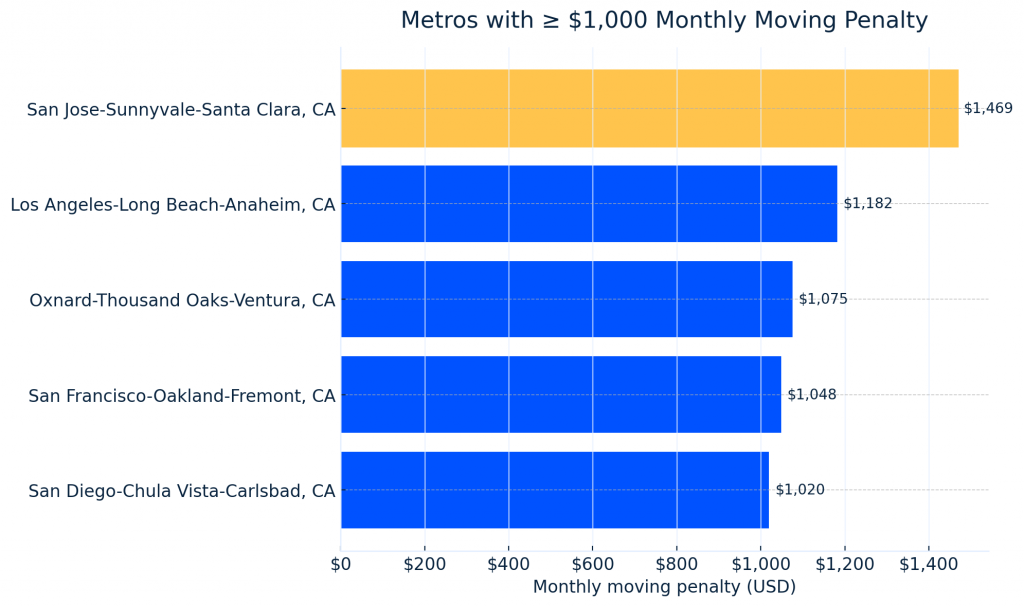
2. San Jose-Sunnyvale-Santa Clara, CA homeowners with 4% mortgages save $1,469 monthly compared to buying at today’s rates, more than many people’s entire mortgage payments a decade ago.
A family locked into a $1.37 million home at 4% pays $6,138 monthly PITI (Principal, Interest, Taxes, and Insurance) but purchasing that same home today at 6.19% (Freddie Mac PMMS, week ending October 23, 2025) would cost $7,606. Over 30 years, staying put saves them $528,663.
Top 10 Metros with Highest Moving Penalties (6.19% vs 4% Interest Rate)
Rank | Metro | Monthly Penalty | Annual Moving Penalty | 30-Year Total |
|---|---|---|---|---|
1. | San Jose-Sunnyvale-Santa Clara, CA | $1,469 | $17,622 | $528,663 |
2. | Los Angeles-Long Beach-Anaheim, CA | $1,182 | $14,180 | $425,408 |
3. | Oxnard-Thousand Oaks-Ventura, CA | $1,075 | $12,902 | $387,056 |
4. | San Francisco-Oakland-Fremont, CA | $1,048 | $12,580 | $377,409 |
5. | San Diego-Chula Vista-Carlsbad, CA | $1,020 | $12,238 | $367,151 |
6. | Boston-Cambridge-Newton, MA-NH | $873 | $10,477 | $314,314 |
7. | Bridgeport-Stamford-Danbury, CT | $860 | $10,316 | $309,475 |
8. | Seattle-Tacoma-Bellevue, WA | $827 | $9,922 | $297,669 |
9. | New York-Newark-Jersey City, NY-NJ | $817 | $9,800 | $293,992 |
10. | Urban Honolulu, HI | $699 | $8,387 | $251,606 |
3. Five California metros show four-figure monthly savings for those with low rates, creating the nation’s most locked-in housing markets.
Homeowners staying put save $1,469 in San Jose, $1,182 in Los Angeles, $1,075 in Oxnard, $1,048 in San Francisco, and $1,020 in San Diego, affecting ~25 million residents across these metros
4. 35 metros show moving penalties exceeding $500 monthly for those who would trade low rates for 6.19%.
This includes unexpected places like Spokane ($537), Boise ($644), and Denver ($644), proving that the golden handcuffs extend far beyond traditional high-cost areas.

Amresh Singh
Founder, CEO, and Mortgage Expert Ziffy
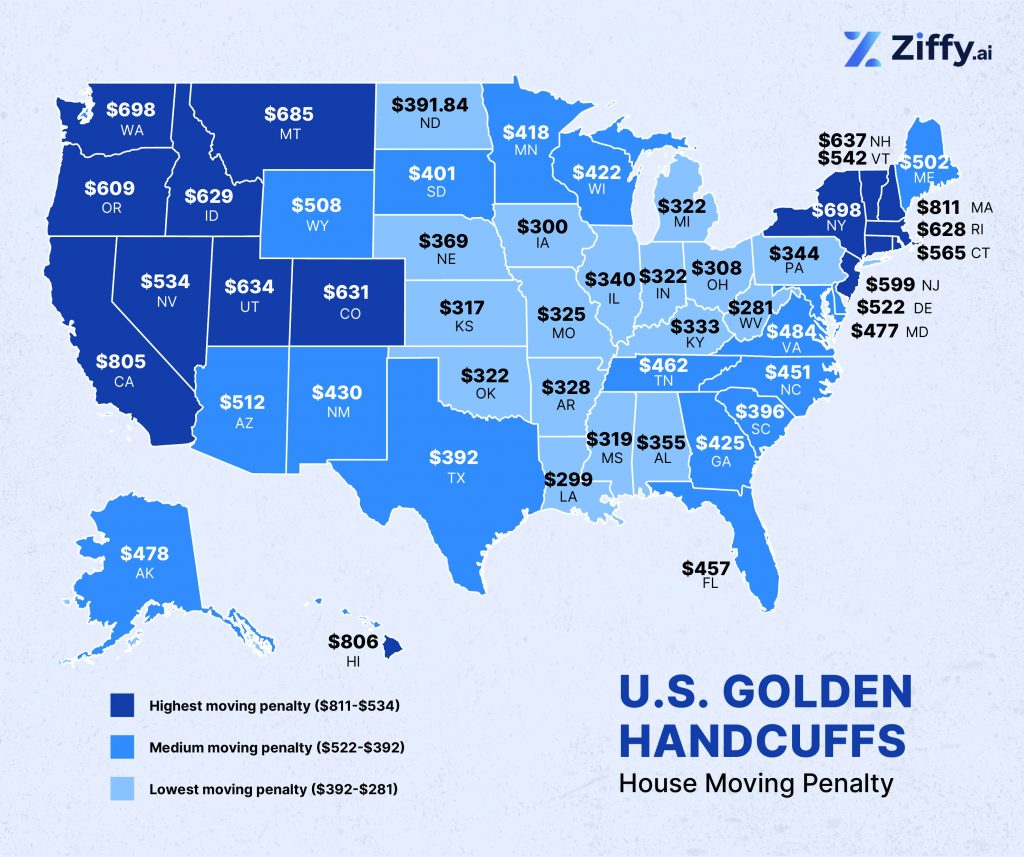
5. Massachusetts has the highest moving penalty at approximately $811 per month.
Hawaii ($806/m) and California ($805/m) are also above $700/m; New York ($698/m) and Washington ($698/m) are close behind. This coastal premium largely reflects high home prices and rising insurance costs (with local taxes/fees varying by county). Across these top states, the average homeowner would pay roughly $8,400–$9,700 more per year in monthly housing costs (driven primarily by interest) to move to an equivalent home at today’s rates.
6. The Sunbelt and Midwest offer relative relief with penalties ranging from $300-$475, though no state escapes the lock-in effect.
Texas averages $392 monthly despite recent price surges, while Florida’s $457 penalty comes with the added burden of skyrocketing insurance. Midwest states like Ohio ($308), Indiana ($322), and Illinois ($340) show the lowest penalties, yet even these “affordable” regions would cost movers an extra $3,700-$5,100 annually. Wisconsin ($422) stands as an outlier, approaching Southern state levels.
7. The geography of golden handcuffs spans the entire nation, with 35 metros exceeding $500 monthly penalties across 22 different states.
From coastal giants to mountain boomtowns to Rust Belt cities, the lock-in effect has created a broad slowdown. Nine metros cross the $700 threshold, while five breach $1,000 monthly, all in California. This isn’t just a blue state problem: red states like Texas, Utah, and Idaho all have metros where moving would cost homeowners $500+ more each month.
What Americans Need Today vs. What They Earn
1. Across the top-100 metros, the average required income is $119,405 while the average local median household income is $81,563, a $37,842 shortfall.
This 46.4% gap means that even dual-income professional households cannot qualify for mortgages at current rates, fundamentally breaking the traditional path to homeownership. As the Federal Housing Finance Agency found, this lock-in effect has prevented 1.33 million home sales from mid-2022 to 2023, reducing transactions by 57%.
2. Los Angeles-Long Beach-Anaheim, CA leads the nation where residents would need $263,445 to qualify for a $1,099,000 home on their $91,960 income.
This 186% gap, requiring nearly triple current earnings, makes homeownership out of reach for middle-class families trying to enter the market today. The city’s 13.2 million residents face the steepest affordability cliff in America.
Top 10 Metros Where Homebuyers can’t Afford their Own Homes
Rank | Metro | Required Income | Actual Median Income | Income Gap % | Income Shortfall |
|---|---|---|---|---|---|
1. | Los Angeles-Long Beach-Anaheim, CA | $263,445 | $91,960 | 186% | $171,485 |
2. | Oxnard-Thousand Oaks-Ventura, CA | $240,220 | $107,327 | 124% | $132,893 |
3. | San Diego-Chula Vista-Carlsbad, CA | $228,166 | $103,674 | 120% | $124,492 |
4. | San Jose-Sunnyvale-Santa Clara, CA | $325,974 | $153,202 | 113% | $172,772 |
5. | New York-Newark-Jersey City, NY-NJ | $188,203 | $95,220 | 98% | $92,983 |
6. | Bridgeport-Stamford-Danbury, CT | $213,969 | $111,058 | 93% | $102,911 |
7. | Miami-Fort Lauderdale-West Palm Beach, FL | $141,502 | $76,271 | 86% | $65,231 |
8. | Boston-Cambridge-Newton, MA-NH | $204,214 | $110,697 | 84% | $93,517 |
9. | Providence-Warwick, RI-MA | $153,377 | $83,330 | 84% | $70,047 |
10. | San Francisco-Oakland-Fremont, CA | $234,378 | $127,792 | 83% | $106,586 |
3. San Jose-Sunnyvale-Santa Clara, CA demands the highest absolute income at $325,974 for its $1,365,750 average home at today’s rates.
Even with Silicon Valley’s $153,202 median household income (already twice the national average) residents fall $172,772 short. Tech workers earning $200,000 individually still need a second high earner to qualify for mortgages at current rates.
4. New York-Newark-Jersey City, NY-NJ metro residents would need essentially double their income to afford local housing at today’s rates.
The 98% gap between the required $188,203 and actual $95,220 earnings affects 19.6 million people across the nation’s largest metro, where even outer boroughs have become unattainable for those without locked-in low rates.
5. Only 3 of 100 metros remain affordable at current rates: Pittsburgh with a 4% income surplus, Akron with 2%, and Rochester with marginal affordability.
These cities represent just 2.3 million households where average earners can still qualify for average homes at today’s rates, though all could flip with minor rate increases.

Debjit Saha
Co-Founder and Real Estate ExpertZiffy
6. Four California metros have crossed the devastating 100% income gap threshold, requiring residents to literally double their earnings.
Los Angeles (186% gap), Oxnard (124%), San Diego (120%), and San Jose (113%) represent 27 million residents living in markets where the median home requires twice the median income. This isn’t just unaffordable, it’s statistically out of reach under standard underwriting for entire generations. Even high earners in these metros need dual six-figure incomes: a San Jose household earning $200,000 still falls $126,000 short of qualifying for the median home.
7. The affordability crisis reaches deep into middle America, with 34 metros requiring 50%+ more income than residents earn.
This includes unexpected places like Boise (70% gap), Nashville (58%), Austin (46%), and Denver (44%). The pandemic-era migration destinations that promised affordability have become the new frontier of the housing crisis. From tech hubs to retirement havens to remote work refuges, one-third of America’s major metros now require incomes at least 50% higher than what local workers actually earn, affecting 45 million Americans across 26 states.
Regional Statistics: How Geography Shapes the Lock-in Effect
1. California’s 10 metros average a 92.4% affordability gap; the worst regional crisis in America.
With the burden concentrated in the big coastal hubs; Los Angeles–Long Beach–Anaheim (186% income gap; $1,182/mo moving penalty), Oxnard–Thousand Oaks–Ventura (124%; $1,075), San Diego–Chula Vista–Carlsbad (120%; $1,020), San Jose–Sunnyvale–Santa Clara (113%; $1,469), and San Francisco–Oakland–Berkeley (83%; $1,048).
While inland markets such as Riverside–San Bernardino–Ontario, Sacramento–Roseville–Folsom, Stockton, Fresno, and Bakersfield show smaller penalties than the coast yet still remain out of reach for median-income households under standard underwriting. Statewide, the average moving penalty is $805 per month ($9,660/year), about 1.6× the national average ($492.97).
2. Texas markets shatter the affordability myth with all 6 major metros now unaffordable at current rates.
Texas’s affordability pressure is concentrated in a mix of fast-growing metros and border markets; McAllen–Edinburg–Mission (58% income gap; $290/mo moving penalty), El Paso (55%; $320), Austin–Round Rock–San Marcos (45%; $532), Dallas–Fort Worth–Arlington (44%; $457), San Antonio–New Braunfels (37%; $355), and Houston–Pasadena–The Woodlands (36%; $387), where median incomes trail the required incomes at a 28% front-end DTI despite comparatively moderate monthly penalties versus coastal markets.
Statewide, the average moving penalty is $392/month ($4,709/year), about 0.8× the national average ($492.97), meaning Texas households face affordability shortfalls driven more by price growth outpacing income than by the size of the rate-driven penalty alone.
3. Florida’s 62.4% average affordability gap combines with insurance costs that add $480 monthly to housing burdens.
Florida’s affordability gap is among the nation’s widest across multiple metros; Miami–Fort Lauderdale–West Palm Beach (86% gap; $538/mo penalty), North Port–Bradenton–Sarasota (72%; $511), Deltona–Daytona Beach–Ormond Beach (70%; $416), Tampa–St. Petersburg–Clearwater (65%; $443), Cape Coral–Fort Myers (64%; $430), and Orlando–Kissimmee–Sanford (58%; $452), reflecting elevated price levels and rising insurance costs that keep required incomes well above local medians.
Statewide, the average moving penalty is $457/month ($5,484/year), about 0.95× the national average ($492.97), so while Florida’s penalty is closer to national, the income gap remains severe in key metros due to insurance and price dynamics.
4. The Northeast corridor from Boston to DC averages 57% unaffordable despite high regional incomes.
Boston’s 84% gap and $873 monthly moving penalty ranks 6th nationally, while New York’s 98% gap affects the nation’s largest metro. Only Pittsburgh remains affordable at current rates, offering a lone refuge in the region.
5. Mountain West markets that attracted pandemic migrants now average 51% gaps, trapping recent buyers.
Boise’s 70% gap, Denver’s 44%, and Salt Lake City’s 46% represent the dark side of remote work migration. Those who bought during the pandemic boom are now locked in by both high prices and their relatively low rates compared to 6.19% (Freddie Mac PMMS).
Full Data: Top 100 U.S. Metros by Income Gap and Moving Penalty (6.19% vs 4% rate)
Methodology
Scope & Selection
- Metros: Analysis covers the top 100 U.S. metropolitan areas by population (U.S. Census Bureau).
- States: State-level rankings and insights are computed separately (see below) using the same assumptions for comparability.
Data Sources:
- Home prices (metros): Ziffy.ai median listing prices (Sept 2025)
- Home prices (states): Ziffy.ai state median listing prices (Sept 2025)
- Household income (metros): U.S. Census American Community Survey 2023
- Mortgage rates: 6.27% (Freddie Mac PMMS, week ending October 23, 2025) current market rate vs 4% comparison rate
- Home Insurance by State: Bankrate
- Property Tax Rates by State: Bankrate (For metro areas spanning multiple states (e.g., New York–Newark–Jersey City, NY–NJ), property tax and home insurance values were based on the primary state of the metro area.)
- Population: U.S. Census Bureau Metropolitan Statistical Area population estimates (2023).
Assumptions (applied consistently to metro and state computations)
- 20% down payment; 30-year fixed mortgage
- PITI includes principal, interest, property tax, and homeowners insurance; excludes HOA/PMI and other debts
- 28% front-end DTI threshold for affordability checks
Calculations
- Metro affordability (“required income”): Required income = (Total monthly PITI × 12) / 0.28
- Income gap % (metros): ((Required − Actual median household income) / Actual) × 100
- Moving penalty (metros & states): Monthly PITI at 6.27% − Monthly PITI at 4.00%
- State-based insights & rankings: Computed using state median home prices (Ziffy.ai, Sept 2025) plus the same state-level property tax and homeowners insurance inputs as metro analyses, with the same 20% down and rate assumptions to ensure comparability.
Rounding
- Dollar figures rounded to the nearest dollar; percentages to one decimal place unless otherwise noted.
Notes
- Figures reflect typical conditions under conservative lending standards; actual borrower outcomes may vary by underwriting, property characteristics, and local taxes/insurance.
- State-level moving penalties rank states on the computed monthly “rate-swap” cost given the assumptions above; metro vs. state results are not interchangeable and may differ due to scope and inputs.