Save Search
Filters Applied
EditEdit Filters
Price: $300K - 500K
Monthly Cash Flow: 1 - 3k+
Home Type: Single Family
Loading Maps & Overview...
Loading Calculator...


A quick, investor-focused snapshot highlighting income strength, yield potential.
| Key metrics | Value |
|---|---|
| Price | $399,900 |
| Est. Rent | $3,200/mo |
| ROI | 18% |
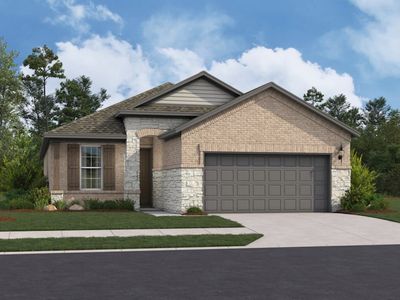
Investment property for sale in San Antonio at 8130 Floating, San Antonio, TX, 78255 with 5% annual appreciation on a $425,000 basis while $2,760/mo rent supports operations. 04% in year one. Equity gained on principal adds $2,742/yr, and five-year appreciation sums $117,420 alongside rental yield of 7.79%. Five-year ROI measures 88.88% and total cumulative return in cash totals $125,225. Investors can finance this property with Ziffy Mortgage’s DSCR loan that underwrites to $2,760/mo property income versus a $2,080/mo payment rather than your W2s, Paystubs, Tax returns, or 1099 forms.
Single Family
Built in 2005
6,316 sqft lot
$N/A/sqft
$225 quarterly HOA
Neighborhood data shown for ZIP Code: 78255, San Antonio, TX area.
| Category | Value |
|---|---|
| Total HU (Housing Units) | 8,946 (100%) |
| Owner Occupied HU | 5,821 (65.1%) |
| Renter Occupied HU | 2,263 (25.3%) |
| Vacant Housing Units | 862 ( 9.6%) |
| Median Home Value | $490,774 |
| Average Home Value | $527,540 |
Residential
7,308
Single Family
6,526
Multi-Family
782
Businesses
95
Date | Event | Price |
|---|---|---|
| 2025-04-10 | Listed for sale | $425,000 |
| 2020-03-13 | Sold | N/A |
| 2018-09-28 | Sold | N/A |
Date | Tax Paid | Tax Increase Rate | Value | Value Increase Rate |
|---|---|---|---|---|
| 2024-04-10 | $6594.76 | 9.30% | $371,429 | 10.00% |
| 2023-04-10 | $6033.70 | -10.08% | $337,663 | 10.00% |
| 2022-04-10 | $6710.07 | 16.34% | $306,966 | 10.00% |
What's Special
Access Only
Listed by: Jack Farquhar • 1st Choice Realty Group
Mls Name: SABOR
Mls Provider:
Mls ID: #1857155
Disclaimer: IDX information is provided exclusively for personal, non-commercial use, and may not be used for any purpose other than to identify prospective properties consumers may be interested in purchasing. Information is deemed reliable but not guaranteed.