Save Search
Filters Applied
EditEdit Filters
Price: $300K - 500K
Monthly Cash Flow: 1 - 3k+
Home Type: Single Family
Loading Maps & Overview...
Loading Calculator...


A quick, investor-focused snapshot highlighting income strength, yield potential.
| Key metrics | Value |
|---|---|
| Price | $399,900 |
| Est. Rent | $3,200/mo |
| ROI | 18% |
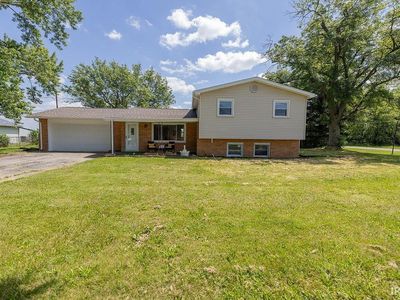
Rental property for sale in Muncie at 2313 N Maplewood Ave, Muncie, IN, 47304 generates $1,676/mo in rent and, after a $832/mo payment, leaves $653/mo in cash flow. Total monthly income is $1,676/mo, and annual cash flow is $7,834/yr on $56,322 invested. Return on cash invested sits at 33.82% in year one, and rental yield is 11.84% on a $169,900 entry. Equity gained on principal adds $1,096/yr, while 5% annual appreciation builds toward $46,940 over five years. Five-year ROI reaches 177.21% and total cumulative return in cash sums $99,806. For financing, investors can use Ziffy Mortgage’s DSCR loan, which considers $1,676/mo property income rather than buyer’s personal income.
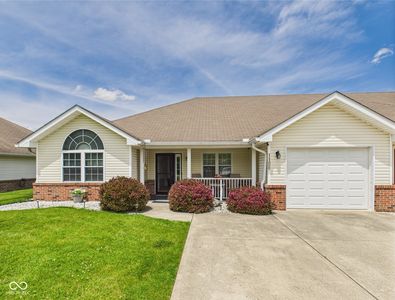
Single Family
Built in 1940
7,840 sqft lot
$N/A/sqft
No HOA
Neighborhood data shown for ZIP Code: 47304, Muncie, IN area.
| Category | Value |
|---|---|
| Total HU (Housing Units) | 14,248 (100%) |
| Owner Occupied HU | 8,917 (62.6%) |
| Renter Occupied HU | 4,021 (28.2%) |
| Vacant Housing Units | 1,310 ( 9.2%) |
| Median Home Value | $182,063 |
| Average Home Value | $213,231 |
Residential
14,165
Single Family
13,054
Multi-Family
1,111
Businesses
706
Date | Event | Price |
|---|---|---|
| 2025-06-26 | Listed for sale | $169,900 |
Date | Tax Paid | Tax Increase Rate | Value | Value Increase Rate |
|---|---|---|---|---|
| 2024-06-27 | $1444.98 | 12.45% | $161,800 | 11.97% |
| 2023-06-27 | $1284.98 | 7.89% | $144,500 | 12.45% |
| 2022-06-27 | $1190.98 | 19.57% | $128,500 | 7.89% |
Listed by: Sherry Anderson • RE/MAX Real Estate Groups
Mls Name: IRMLS
Mls Provider:
Mls ID: #202524532
Disclaimer: IDX information is provided exclusively for personal, non-commercial use, and may not be used for any purpose other than to identify prospective properties consumers may be interested in purchasing. Information is deemed reliable but not guaranteed.