Save Search
Filters Applied
EditEdit Filters
Price: $300K - 500K
Monthly Cash Flow: 1 - 3k+
Home Type: Single Family
Loading Maps & Overview...
Loading Calculator...


A quick, investor-focused snapshot highlighting income strength, yield potential.
| Key metrics | Value |
|---|---|
| Price | $399,900 |
| Est. Rent | $3,200/mo |
| ROI | 18% |
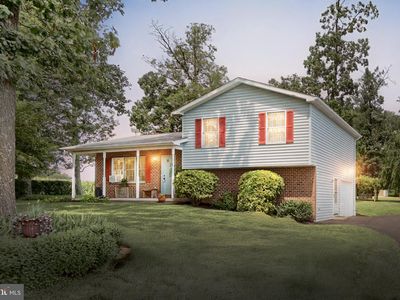
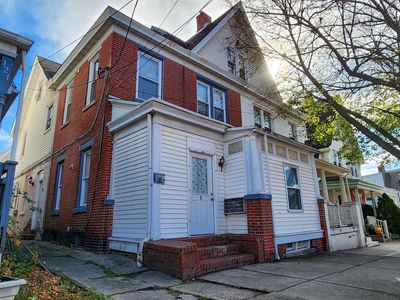
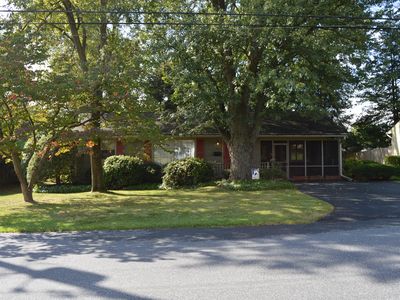
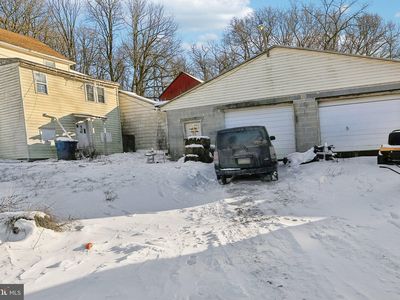
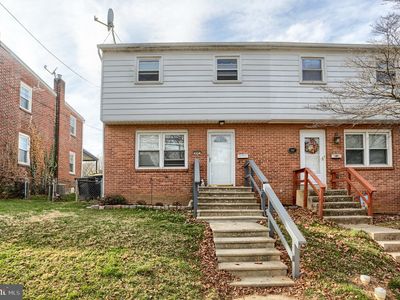
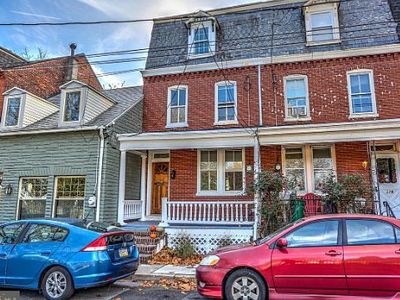
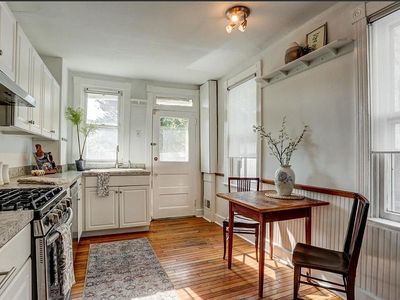
Investment property for sale in Lancaster at 230 E Lemon St, Lancaster, PA, 17602 uses $87,848 cash to close to unlock $2,466/yr annual cash flow and $206/mo monthly cash flow. Total monthly income runs $1,942/mo, and a $1,297/mo payment keeps the spread at $206/mo. Purchase price stands at $265,000, and rental yield measures 8.79% with $1,942/mo rent. Return on cash invested shows 22.72% in year one, and 5% annual appreciation builds toward $73,215 over five years. Five-year ROI reaches 118.38% and total cumulative return in cash records $103,995. Financing may use Ziffy Mortgage’s DSCR loan, which bases approval on $1,942/mo property income covering a $1,297/mo payment rather than investor’s personal income.
Single Family
Built in 1900
871 sqft lot
$N/A/sqft
No HOA
Neighborhood data shown for ZIP Code: 17602, Lancaster, PA area.
| Category | Value |
|---|---|
| Total HU (Housing Units) | 21,730 (100%) |
| Owner Occupied HU | 10,881 (50.1%) |
| Renter Occupied HU | 9,451 (43.5%) |
| Vacant Housing Units | 1,398 ( 6.4%) |
| Median Home Value | $317,822 |
| Average Home Value | $353,635 |
Residential
19,755
Single Family
17,487
Multi-Family
2,268
Businesses
1,375
Date | Event | Price |
|---|---|---|
| 2025-04-07 | Listed for sale | $265,000 |
| 2023-12-06 | Listing removed | N/A |
| 2023-11-27 | Listed for rent | $2,000 |
Date | Tax Paid | Tax Increase Rate | Value | Value Increase Rate |
|---|---|---|---|---|
| 2024-04-08 | $3814.51 | 1.71% | $96,400 | N/A |
| 2023-04-08 | $3750.36 | 4.35% | $96,400 | N/A |
| 2022-04-08 | $3594.19 | N/A | $96,400 | N/A |
Listed by: N/A • N/A
Mls Name: undefined
Mls ID: #N/A