Save Search
Filters Applied
EditEdit Filters
Price: $300K - 500K
Monthly Cash Flow: 1 - 3k+
Home Type: Single Family
Loading Maps & Overview...
Loading Calculator...


A quick, investor-focused snapshot highlighting income strength, yield potential.
| Key metrics | Value |
|---|---|
| Price | $399,900 |
| Est. Rent | $3,200/mo |
| ROI | 18% |
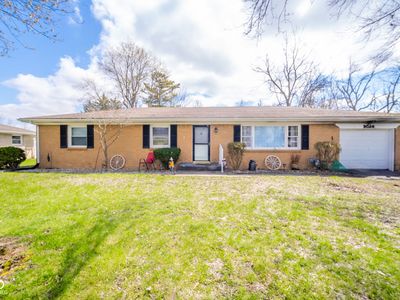
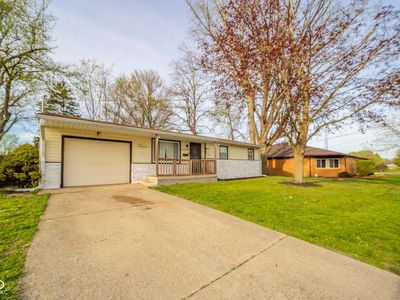
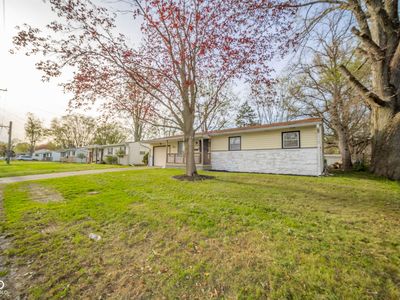
Rental property for sale in New Castle at 2230 Q Ave, New Castle, IN, 47362 priced at $169,900 converts $1,590/mo rent into $570/mo cash flow after a $832/mo obligation. Total monthly income equals $1,590/mo, and annual cash flow totals $6,836/yr on $56,322 invested. Return on cash invested prints 32.05% in year one, and rental yield reads 11.23% against a $169,900 entry. Equity gained on principal adds $1,096/yr, while 5% annual appreciation compiles into $46,940 by year five. Five-year ROI reaches 167.72% and total cumulative return in cash sums $94,466. For leverage, Ziffy Mortgage’s DSCR loan bases approval on $1,590/mo property income covering a $832/mo payment, not borrower’s personal income.
Single Family
Built in 1964
0.25 Acres lot
$N/A/sqft
No HOA
Date | Event | Price |
|---|---|---|
| 2025-04-25 | Listed for sale | $169,900 |
| 2020-06-29 | Sold | $79,500 |
| 2020-05-29 | Listed for sale | $79,500 |
Date | Tax Paid | Tax Increase Rate | Value | Value Increase Rate |
|---|---|---|---|---|
| 2024-04-28 | $577.24 | 7.19% | $84,300 | 30.50% |
| 2023-04-28 | $538.52 | 6.00% | $64,600 | 4.53% |
| 2022-04-28 | $508.06 | 2.59% | $61,800 | 7.67% |
What's Special
Access Only
Listed by: Steffanie Hensley • RE/MAX At The Crossing
Mls Name: MIBOR as distributed by MLS GRID
Mls Provider:
Mls ID: #22034719
Disclaimer: Based on information submitted to the MLS GRID as of 2025-04-28 07:57:47 PDT. All data is obtained from various sources and may not have been verified by broker or MLS GRID. Supplied Open House Information is subject to change without notice. All information should be independently reviewed and verified for accuracy. Properties may or may not be listed by the office/agent presenting the information. Some IDX listings have been excluded from this website. [Click here for more information](/mls-disclaimers/#48)