Save Search
Filters Applied
EditEdit Filters
Price: $300K - 500K
Monthly Cash Flow: 1 - 3k+
Home Type: Single Family
Loading Maps & Overview...
Loading Calculator...


A quick, investor-focused snapshot highlighting income strength, yield potential.
| Key metrics | Value |
|---|---|
| Price | $399,900 |
| Est. Rent | $3,200/mo |
| ROI | 18% |
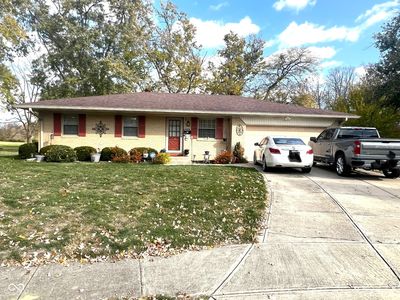
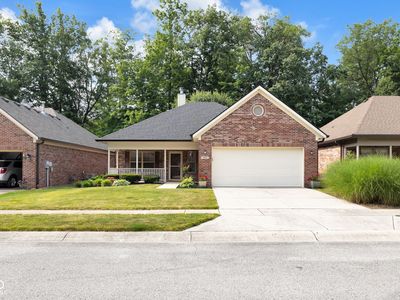
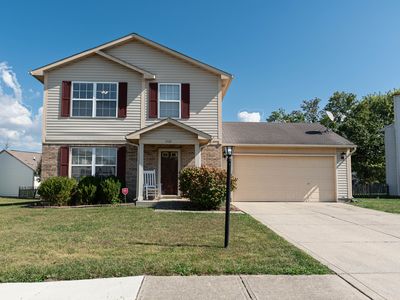
Investment property for sale in Indianapolis at 2021 Bradford Trace Blvd, Indianapolis, IN, 46229 listed at $239,900 pairs $1,812/mo rent with a $1,174/mo payment to leave $372/mo cash flow. Total monthly income runs $1,812/mo, and annual cash flow reaches $4,465/yr on $79,527 cash to close. Return on cash invested measures 25.52% in year one, and rental yield registers 9.06% at a $239,900 basis. Equity gained on principal adds $1,548/yr, and annual property appreciation at 5% supports $66,280 by year five. Five-year ROI tracks 132.75% and total cumulative return in cash totals $105,571. Financing can be arranged with Ziffy Mortgage’s DSCR loan, which qualifies using $1,812/mo property income relative to a $1,174/mo payment rather than your personal income (W2, Tax Returns, Paystubs, or 1099).
Single Family
Built in 1999
10,018 sqft lot
$N/A/sqft
No HOA
Neighborhood data shown for ZIP Code: 46229, Indianapolis, IN area.
| Category | Value |
|---|---|
| Total HU (Housing Units) | 11,954 (100%) |
| Owner Occupied HU | 6,415 (53.7%) |
| Renter Occupied HU | 4,840 (40.5%) |
| Vacant Housing Units | 699 ( 5.8%) |
| Median Home Value | $226,104 |
| Average Home Value | $283,888 |
Residential
11,928
Single Family
10,510
Multi-Family
1,418
Businesses
682
Date | Event | Price |
|---|---|---|
| No price history data available | ||
Date | Tax Paid | Tax Increase Rate | Value | Value Increase Rate |
|---|---|---|---|---|
| No tax history data available | ||||
Listed by: Felman Brown • Carpenter, REALTORS
Mls Name: MIBOR as distributed by MLS GRID
Mls ID: #22066824