Save Search
Filters Applied
EditEdit Filters
Price: $300K - 500K
Monthly Cash Flow: 1 - 3k+
Home Type: Single Family
Loading Maps & Overview...
Loading Calculator...


A quick, investor-focused snapshot highlighting income strength, yield potential.
| Key metrics | Value |
|---|---|
| Price | $399,900 |
| Est. Rent | $3,200/mo |
| ROI | 18% |
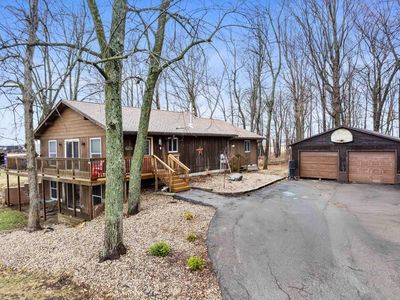
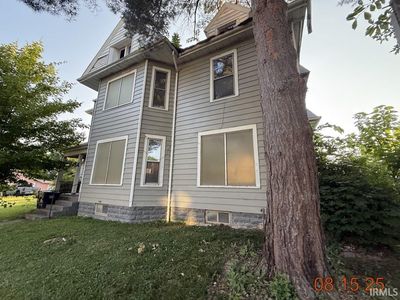
Rental property for sale in Muncie at 2017 S Hackley St, Muncie, IN, 47302 generates $1,140/mo in rent and, after a $587/mo payment, leaves $420/mo in cash flow. Total monthly income is $1,140/mo, and annual cash flow is $5,041/yr on $39,747 invested. Return on cash invested sits at 32.59% in year one, and rental yield is 11.41% on a $119,900 entry. Equity gained on principal adds $774/yr, while 5% annual appreciation builds toward $33,126 over five years. Five-year ROI reaches 170.73% and total cumulative return in cash sums $67,860. For financing, investors can use Ziffy Mortgage’s DSCR loan, which considers $1,140/mo property income rather than buyer’s personal income.
Single Family
Built in 1939
4,791 sqft lot
$N/A/sqft
No HOA
Neighborhood data shown for ZIP Code: 47302, Muncie, IN area.
| Category | Value |
|---|---|
| Total HU (Housing Units) | 12,894 (100%) |
| Owner Occupied HU | 7,150 (55.5%) |
| Renter Occupied HU | 3,985 (30.9%) |
| Vacant Housing Units | 1,759 (13.6%) |
| Median Home Value | $89,088 |
| Average Home Value | $153,660 |
Residential
11,508
Single Family
11,429
Multi-Family
79
Businesses
580
Date | Event | Price |
|---|---|---|
| 2024-10-12 | Listed for sale | $119,900 |
| 2005-09-23 | Sold | $37,185 |
Date | Tax Paid | Tax Increase Rate | Value | Value Increase Rate |
|---|---|---|---|---|
| 2023-10-14 | $358.02 | -36.30% | $39,300 | 9.78% |
| 2022-10-14 | $562.00 | 12.86% | $35,800 | 27.40% |
| 2021-10-14 | $497.98 | 5.06% | $28,100 | 12.85% |
Listed by: Robb Riley • Viking Realty
Mls Name: IRMLS
Mls Provider:
Mls ID: #202439708
Disclaimer: IDX information is provided exclusively for personal, non-commercial use, and may not be used for any purpose other than to identify prospective properties consumers may be interested in purchasing. Information is deemed reliable but not guaranteed.