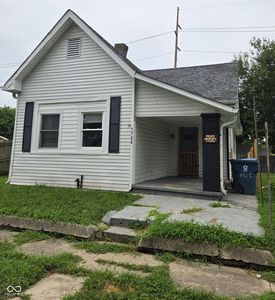
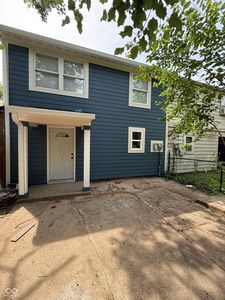
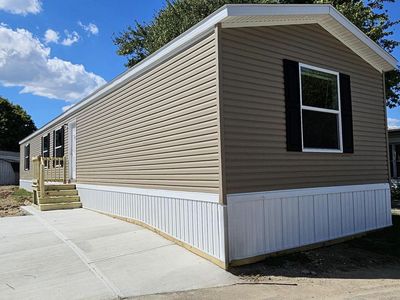
1750 Olive StIndianapolisIN46203
INVESTMENT ANALYSIS
Investment Verdict
Solid Income1750 Olive St, Indianapolis, IN, 46203 in Indianapolis is a solid income-producing rental, 9.55% gross yield, $954/mo rent, $234/mo net cash flow on a $119,900 buy. DSCR 1.77 qualifies the property for Ziffy Mortgage's financing without personal income documentation. Five-year appreciation of $33,126 and $1,104/yr in principal reduction project a total cumulative return of $60,504.
| This Property | City Avg | |
|---|---|---|
| Gross Rental Yield | 9.6% | 6.8% |
| Monthly Cash Flow | $234 | $450 |
City averages based on Indianapolis market data in our database. Property projections are estimates.
DSCR Rental Loan Qualification
Qualifies using the property's rental income, not your personal income.
- ✓No W-2, pay stubs, or tax returns needed
- ✓Rental income qualifies you
- ✓Built for real estate investors
| Monthly Rental Income | $954 |
| Total Monthly Debt Service | $672 |
| DSCR Ratio | 1.42x |
Ziffy Mortgage: Your DSCR most likely meets our 1.0+ requirement, so you'll most probably qualify for our standard DSCR investment loan program. To pre-qualify, book time with your loan officer →
Estimates assume 6.0% rate / 30-yr fixed, 30% down, 1% tax, 0.5% insurance. Not a commitment to lend.
Single Family
Built in 1930
2,613 sqft lot
$N/A/sqft
No HOA
Neighborhood Data
Neighborhood data shown for ZIP Code: 46203, Indianapolis, IN area.
Housing Distribution
Housing Statistics
| Category | Value |
|---|---|
| Total HU (Housing Units) | 18,183 (100%) |
| Owner Occupied HU | 8,432 (46.4%) |
| Renter Occupied HU | 7,696 (42.3%) |
| Vacant Housing Units | 2,055 (11.3%) |
| Median Home Value | $189,972 |
| Average Home Value | $247,147 |
Housing Distribution
Address Breakdown
Residential
16,323
Single Family
15,372
Multi-Family
951
Businesses
1,194


Nearby investment properties with comparable rents

Nearby investment properties with comparable prices

Ziffy AI Summary
A quick, investor-focused snapshot highlighting income strength, yield potential.
| Key metrics | Value |
|---|---|
| Price | $399,900 |
| Est. Rent | $3,200/mo |
| ROI | 18% |
- Attractive rent-to-price ratio for income stability
- Good fit for DSCR financing with healthy coverage
Single Family
Built in 1930
2,613 sqft lot
$N/A/sqft
No HOA
Neighborhood Data
Neighborhood data shown for ZIP Code: 46203, Indianapolis, IN area.
Housing Distribution
Housing Statistics
| Category | Value |
|---|---|
| Total HU (Housing Units) | 18,183 (100%) |
| Owner Occupied HU | 8,432 (46.4%) |
| Renter Occupied HU | 7,696 (42.3%) |
| Vacant Housing Units | 2,055 (11.3%) |
| Median Home Value | $189,972 |
| Average Home Value | $247,147 |
Housing Distribution
Address Breakdown
Residential
16,323
Single Family
15,372
Multi-Family
951
Businesses
1,194
Nearby investment properties with comparable rents
Nearby investment properties with comparable prices
Listed by: Brian Pachciarz • Estansion Group by BLP
Mls Name: MIBOR as distributed by MLS GRID
Mls ID: #22081575