Save Search
Filters Applied
EditEdit Filters
Price: $300K - 500K
Monthly Cash Flow: 1 - 3k+
Home Type: Single Family
Loading Maps & Overview...
Loading Calculator...


A quick, investor-focused snapshot highlighting income strength, yield potential.
| Key metrics | Value |
|---|---|
| Price | $399,900 |
| Est. Rent | $3,200/mo |
| ROI | 18% |
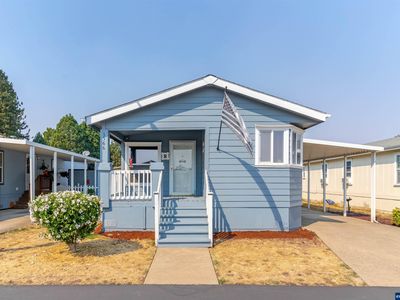
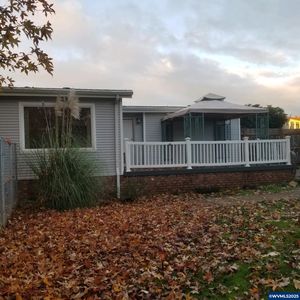
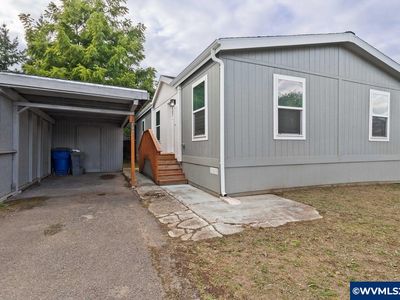
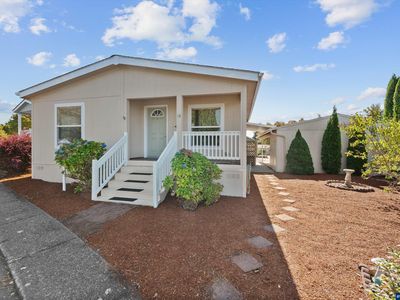
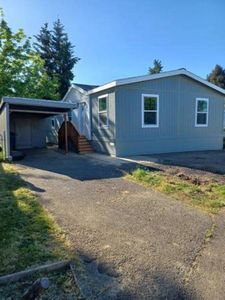
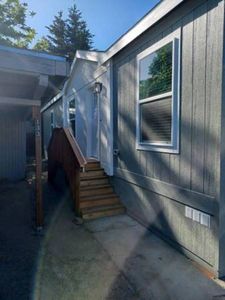
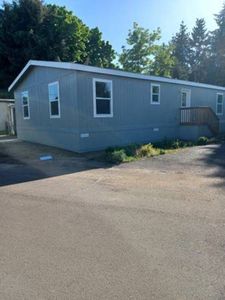
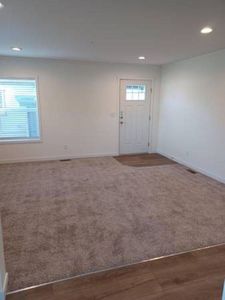
Investment property for sale in Salem at 133 Broadmore Ave NE, Salem, OR, 97301 with 5% annual appreciation on a $129,900 basis while $2,645/mo rent supports operations. Total monthly income totals $2,645/mo and a $636/mo payment preserves $1,861/mo for cash returns. Annual cash flow comes to $22,328/yr on $43,062 deployed, and return on cash invested reaches 71.76% in year one. Equity gained on principal adds $838/yr, and five-year appreciation sums $35,889 alongside rental yield of 24.43%. Five-year ROI measures 380.73% and total cumulative return in cash totals $163,951.
Investors can finance this property with Ziffy Mortgage’s DSCR loan that underwrites to $2,645/mo property income versus a $636/mo payment rather than your W2s, Paystubs, Tax returns, or 1099 forms.
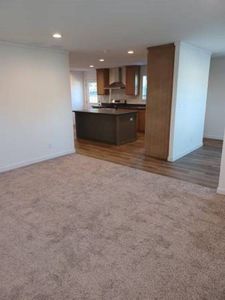
Manufactured
Built in 2024
N/A lot
$N/A/sqft
No HOA
Neighborhood data shown for ZIP Code: 97301, Salem, OR area.
| Category | Value |
|---|---|
| Total HU (Housing Units) | 20,878 (100%) |
| Owner Occupied HU | 9,197 (44.1%) |
| Renter Occupied HU | 10,642 (51.0%) |
| Vacant Housing Units | 1,039 ( 5.0%) |
| Median Home Value | $368,479 |
| Average Home Value | $403,096 |
Residential
20,354
Single Family
18,277
Multi-Family
2,077
Businesses
2,690
Date | Event | Price |
|---|---|---|
| 2024-10-07 | Price change | $129,900 |
| 2024-05-21 | Listed for sale | $134,900 |
Date | Tax Paid | Tax Increase Rate | Value | Value Increase Rate |
|---|---|---|---|---|
| 2022-10-18 | N/A | N/A | N/A | N/A |
| 2021-10-18 | N/A | N/A | $16,420 | -99.56% |
| 2020-10-18 | N/A | N/A | $3,755,290 | N/A |
Listed by: Amy Spencer • J and M Homes,LLC
Mls Name: My State MLS
Mls ID: #11281636